Update:
There were two spikes three hours apart; both were captured by my HTTP session logging program, which logs session detaisl aggregated by IP address. In this case, the code starts logging (kicks off) when the one minute load average exceeds 20 and ends when the same load average exceeds 50. So, in a spike we will record a very short snap shot in time of the traffic (on the way up and on the way down, but I may change this in the future to only capture on the way up).
The results were as follows:
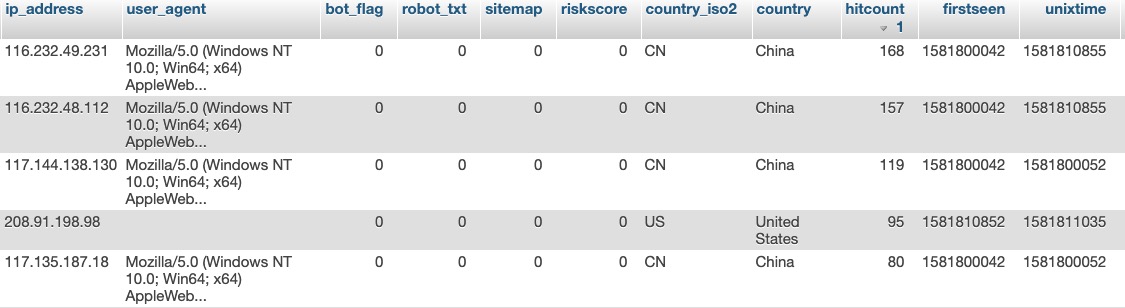
In both spikes, there were at least fort Chinese IP addresses present at the top of the "hit count" chart (the DB table):
- 116.232.49.231
- 116.232.48.112
- 117.144.138.130
- 117.135.187.18
All four of these IP addresses were present during the 4AM and 7AM (Bangkok Time) spikes, and all three identified with the same user agent string:
Mozilla/5.0 (Windows NT 10.0; Win64; x64) AppleWebKit/537.36 (KHTML, like Gecko) Chrome/71.0.3578.98 Safari/537.36
This indicates these IP addresses (in China) are running the same bot software; but that is only an indication (but a fairly strong indication).
However, there is no denying that my "trap the bots" code has identified four Chinese IP addresses running some bot software which is more-than-likely contributing to the cause of the spikes.
In addition, during the same two spikes spaced three hours apart (as mentioned), there was one US-based IP address running with a blank user agent string:
- 208.91.198.98
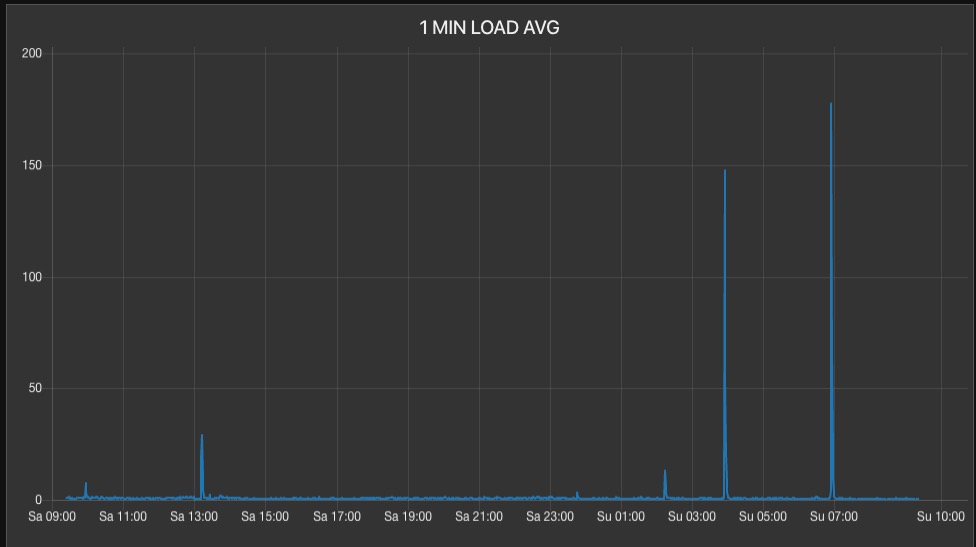
Keep in mind in this capture, the code only captured the session information when the one minute load average was above 20 and below 50, and there were two spikes spaced almost exactly three hours apart:
So, having recorded the events above, I have just now emptied that DB table and have "reset the trap" for the next spikes.
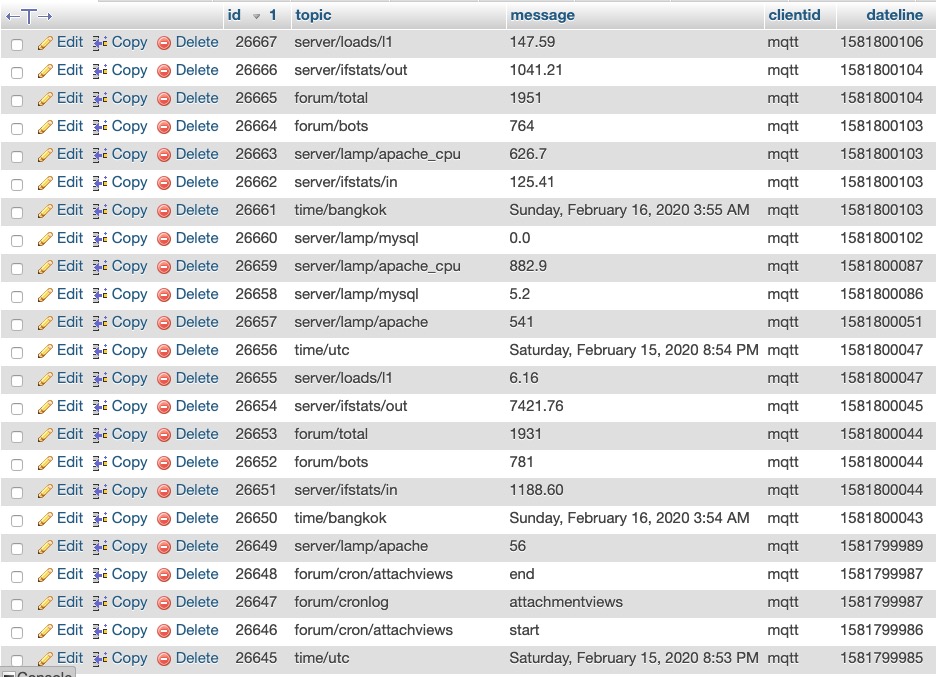
Now, turning our attention to my instrumentation log where I am using MQTT to log all application and system cron (batch) events (start and end times) as well as a number of system metrics, we see there is a correlation (during the first spike) at 1581800045 of a spike in traffic out of the network interface, along with correlating spikes in Apache2 processes and CPU.
Now looking at the second event (spike 2), there is a similar pattern, but of interest in that proceeding both spikes, is an hourly application cron function:
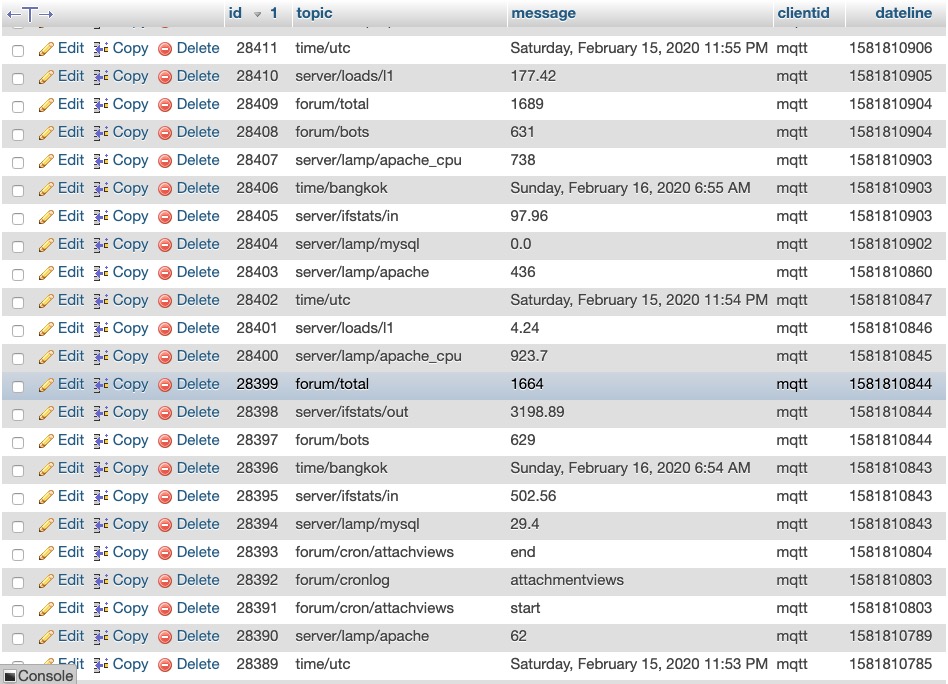
This seems to indicate that the cause of the spikes, in this case, is a combination of aggressive bot activity coincidental with an hourly cron / batch process, causing spikes.
To be more certain of this, I am going to change the time of the "update attachment view" cron process from kicking off on the 53 minute mark of every hour, to the 23 minute mark of every hour, and see if the times of the spikes shift in time as well.