I have been wrangling with a small problem on a Ubuntu server which runs a LAMP application.
Linux ubuntu 4.15.0-33-generic #36-Ubuntu SMP Wed Aug 15 16:00:05 UTC 2018 x86_64 x86_64 x86_64 GNU/Linux
This server runs fine, basically:
ubuntu:/var/www# uptime
 20:17:13 up 105 days, 19:54,  1 user,  load average: 1.38, 1.12, 1.
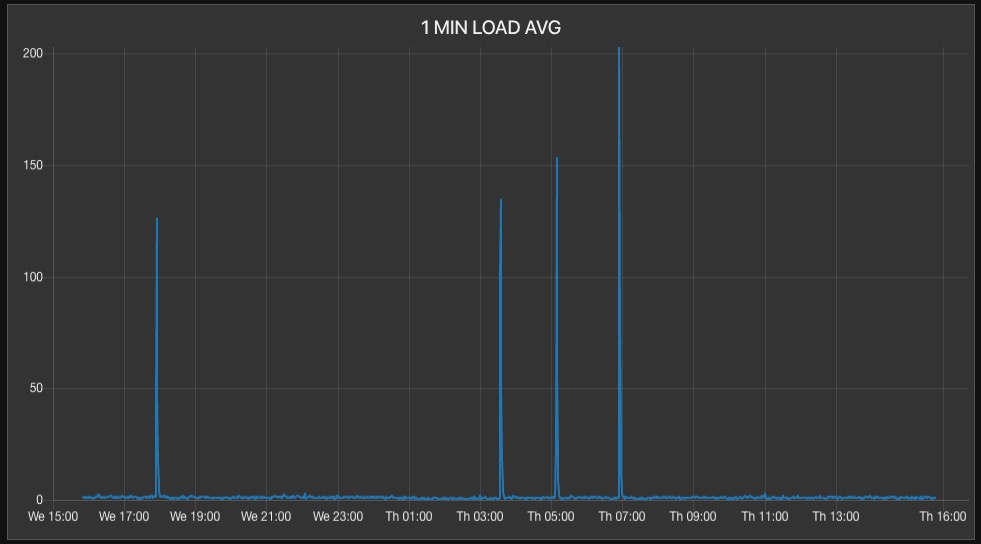
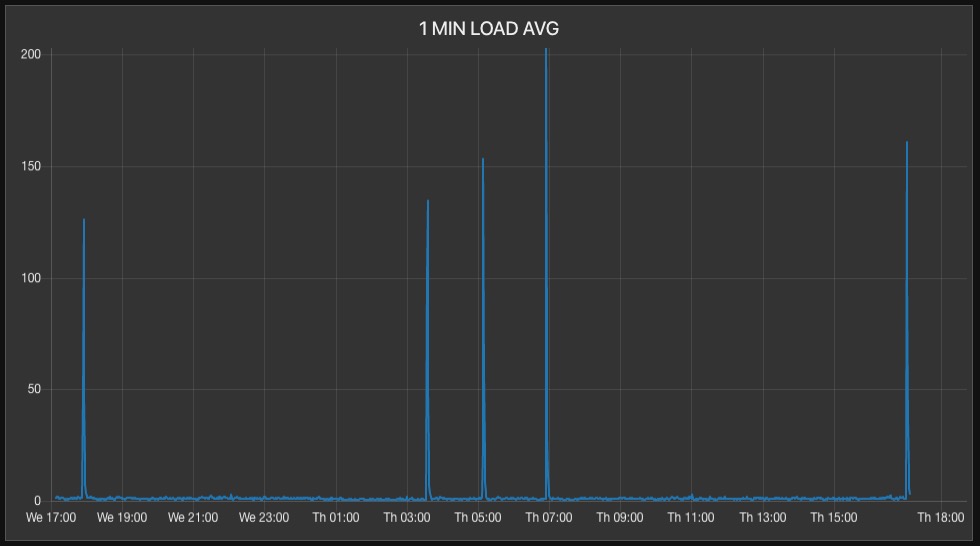
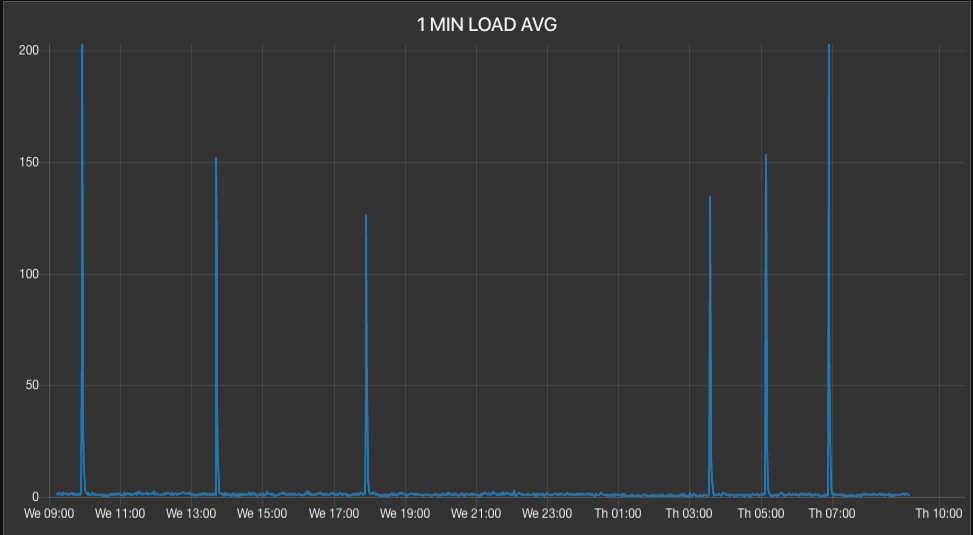
But around five to six times a day, the (1 minute) load average spikes to around 200 and quickly goes back down to normal, all in the time interval of less than one minute:
I have added sensors to the crontab processes, both for the LAMP application and the server crontabs and log all cron start and stop events in the database. This instrumentation of the server yields no fruit.
In addition, in the occasional spurious events that seem to happen at "near regular" intervals, I have had a terminal window open running top , mytop , ifstats and other command line tools trying to trap the process which is causing the load spurs. There has been nothing unusual and mysql is always the "leading contender" when the pikes occur.
There is no other process with a high CPU during the spikes, so that seems to indicate something related to mysql. , obviously.
With only mysql showing up as the "leading contender", I added more instrumentation to various mysql processes in the application, and can find no event on the server or in the application which correlates to this spurious behavior.
I have correlated the spikes to (1) network interface i/o stats, (2) apache processes, (3) all crontab processes (in app and on server) and regardless of my skills at adding sensors to various processes, I cannot trap the spurious process.
I have running time series graphs, and logging in the database. When there is an incident on the graph, I go to the database log and look at all the sensor entries and can find no correlation.
There is no correlation to cron processes, network i/o, users on the server, bots, and backup processes.
I keep adding more and more instrumentation to every process on the server and in the app, but all that instrumentation looking for correlation to a server process, including the LAMP app, bears no fruit.
At first, I thought this problem was caused by bots hitting the web server; but there is no correlation to increased bot traffic or LAN interface I/O.
Then I thought the problem was caused by various cron entries in the LAMP application; but reconfiguring them, turning them on and off, adding instrumentation for start / stop times in a log, also bears no fruit.
I've been working this problem on and off for over a week and cannot find a single causal reason, no a single cause for any effect, which may be causing this spurious load average behavior.
It's only around five to six times a day for less than a minute at each event; but I want to find the cause and fix it. I'm not 100% convinced the issue is caused by a single process / issue.
I wonder if there is some underlying disk I/0 activity on the server causing these spikes? Could this be related to a potential disk error on the SSD drives? Could it be related to underlying disk raid activity?
ubuntu:/etc/mdadm# cat /proc/mdstat
Personalities : [raid1] [linear] [multipath] [raid0] [raid6] [raid5] [raid4] [raid10]
md2 : active raid1 sdb4[1] sda4[0]
      479503360 blocks super 1.2 [2/2] [UU]
      bitmap: 3/4 pages [12KB], 65536KB chunk

md1 : active raid1 sdb3[1] sda3[0]
      7995392 blocks super 1.2 [2/2] [UU]

md0 : active raid1 sdb2[1] sda2[0]
      498688 blocks super 1.2 [2/2] [UU]
If so, any ideas how to trap this?
My current "best guess" is that there is some underlying disk I/O activity causing this spurious issue, and that is why nothing at the application level correlates.