Or, I may use atop (they are all very similar linux command line tools for this kind of thing.... )
Thanks for the suggestions and ideas.
It's great to have some outside input; as it is hard to trace spikes like this.
Thank you again.
Or, I may use atop (they are all very similar linux command line tools for this kind of thing.... )
Thanks for the suggestions and ideas.
It's great to have some outside input; as it is hard to trace spikes like this.
Thank you again.
Another thought I've had is this.
If you can afford to you could stop cron from the command line and see if the spikes go away.
If you can't do that (because you need the cron scheduled processes to run regularly) but you know the footprint of the spike, you could briefly stop the cron process from the command line and then watch for a spike when you issue that cron start. It won't prove anything but does it look similar.
At boot time all crontabs are read into and held in memory and that is CPU intensive. Last modified times of crontabs are also cached. The periodical wake up checks the last modified times between disk and memory. So if you break the rules and modify a crontab directly, a new job you insert won't run at all until an integrity check by cron runs. So, so, so, I guess if you write a ditty to run every 2 seconds that you can monitor and manually insert it into root's crontab, does it start running at the next spike???
Setup metrics in file using cron, something in the line of :
TM=$(date "+%Y%m%d_%H%M")
DDUMP=/some/dir
iostat -ctdxN 15 240 >> ${DDUMP}/iostat_${TM}.out &
mpstat 15 240 >> ${DDUMP}/mpstat_${TM}.out &
vmstat 15 240 >> ${DDUMP}/vmstat_${TM}.out
If cron cannot be used for this, use a while loop in screen session with one hour sleeps between invocations.
There is also an option to install sysstat package which will generate sar metric files with five minute resolution in /var/adm/sa after install of package by default.
From those files you can easily draw graphs using software found online, ksar for instance.
With that data, perhaps a more clear cause could be found.
Hope that helps
Regards
Peasant.
Thanks for the suggestion.
I was sitting at my desk with another spike occurred and there were no unusual or phantom processes popping up.
MySQL remained at the top of the CPU utilization with, followed by apache2, so I'm starting to believe something is going on with MySQL which is causing the spikes.
Since most of the MySQL tables get mostly reads compared to writes, MyISAM is faster for these "mostly reads", according to what I have read, so I have not changed any off the busy tables to INNODB.
Maybe that is the issue?
But I am hesitant to experiment with changing MYISAM tables to INNODB unless there is clear evidence that altering these tables from MYISAM to INNODB will not create more problems (slowing the DB down), than the 5 or 6 one minute spikes per day.
Not sure if this applies here. One time I came across a excessive load pattern with no increase of cpu and io, was when there were a lot of processes in uninterruptible sleep state (D), which accounted for excessive load number, since Linux defines load differently than other *nixes. In our case this happened to be a problem with NFS traffic. We used ps 's wchan option to find out more about the nature of the wait..
Thanks Scrutinizer,
I'm feeling confident that the root cause is related to MySQL (maybe 80% confidence level, off the top of my head).
The reasons are as follows:
mysqld process running "at the top" during peak times.Perhaps, more importantly is that historically, when the server has had a performance issue, the root cause has always been related to mysql performance.
So combining "what we know now" with "what we know from the past", the logical direction to investigate in detail is MySQL .
So, back to MySQL "basics" again, I have reenabled the MySQL slow query log and set the time "back up to 10 seconds" and will see if this traps the antagonist of this caper:
mysql> SET GLOBAL slow_query_log = 'ON';
mysql> SET GLOBAL long_query_time = 10;
Back to basics, as they say.
Since I am using MQTT for most of my instrumentation these days, I may write a parser to parse the output of:
mysqldumpslow /var/log/mysql/neo-mysql-slow.log
... and publish any interesting queries out to my MQTT instrumentation pub/sub bus I use now for consolidating these types of analytical tasks.
For example, in here is an example from logrotate, which is just one example of how I am now experimenting with MQTT to log server events to the DB :
ubuntu# cat certbot
/var/log/letsencrypt/*.log {
    rotate 12
    weekly
    compress
    missingok
    postrotate
    /usr/bin/mosquitto_pub -t server/logrotate -m "letsencrypt.log" -q 1 -u user -P password
    endscript
}
And in the many PHP application cron and server-batch scripts as a part of the LAMP implementation:
$C_Start = '/usr/bin/mosquitto_pub -t forum/cron/cleanup2 -m "start" -q 1 -u user -P password;
$output = shell_exec($C_Start);

 // code

$C_End = '/usr/bin/mosquitto_pub -t forum/cron/cleanup2 -m "end" -q 1 -u user -P password;
$output = shell_exec($C_END);
These days, I do nearly all my server instrumentation using MQTT because I use two MQTT analytical tools on two mobile phones, and one MQTT analysis tool on the desktop, and also use Node-RED on the server-side for analysis and visualization, and of course raw database searches in my instrumentation DB table (and also phpmyadmin , for quick looks).
As it stands now, I am a huge fan of MQTT (these days) to use in a variety of monitoring and instrumentation applications.
If MySQL slow query analysis does not yield any fruit, will need to come up with a new analysis plan / instrumentation. Let's see what happens after a day or two with the MySQL slow query analysis.
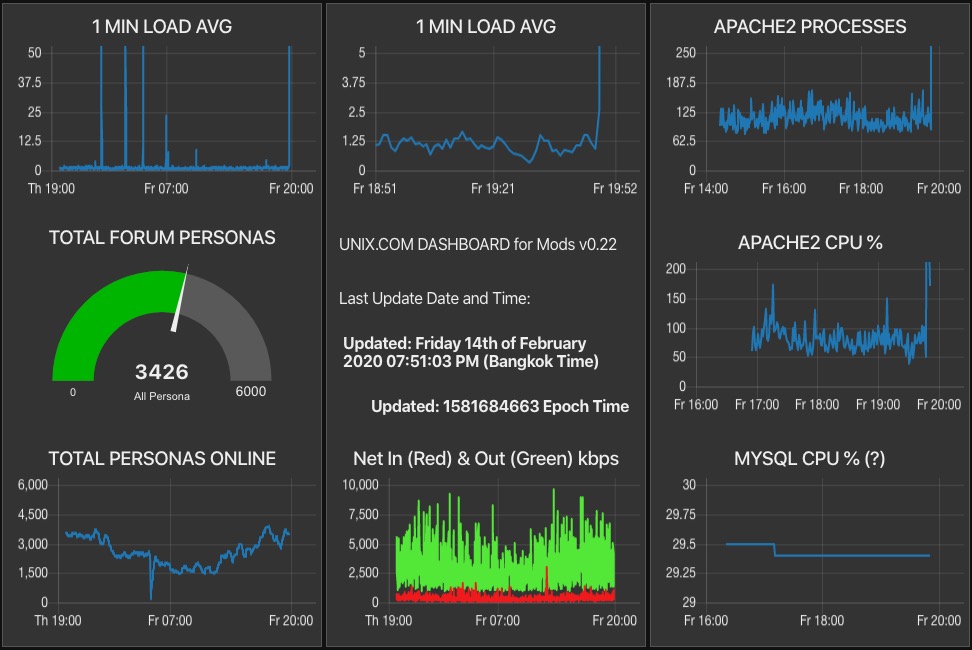
Update:
After adding more instrumentation, including Apache2 processes, Apache2 CPU and a questionable MySQL CPU graph, the first spike of the last half day occurred and there is correlation between the load spikes and sudden increase in Apache2 processes:
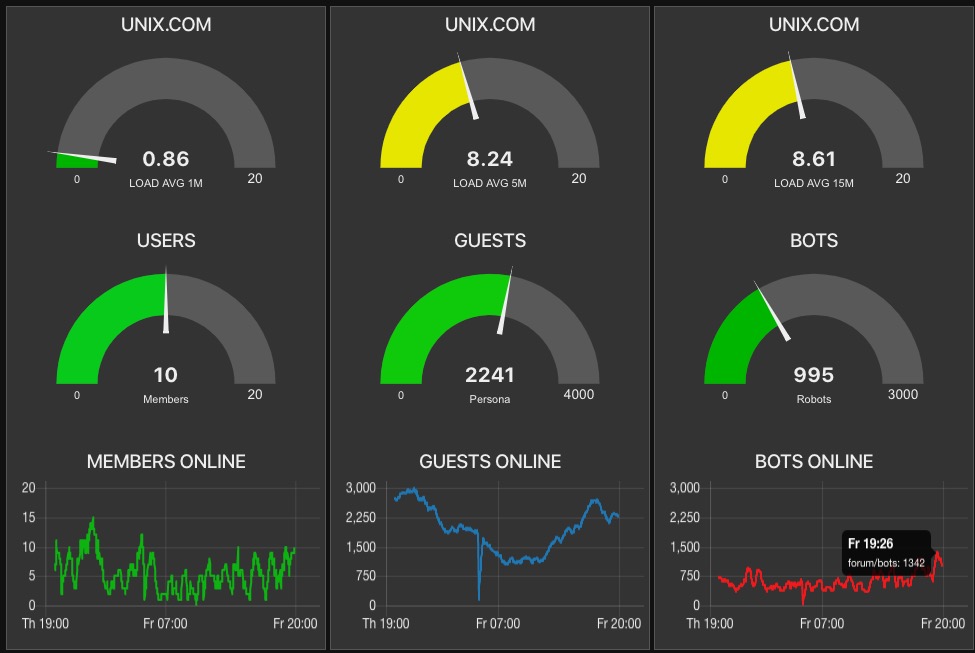
But is is not clear what the cause is since there is no strong correlation to users, guests or bot activity. But there is some potential correlation to bot activity:
Which brings me back, full circle, suspecting rogue bot activity, again.... let's see what happens during the next spike.
Looks like it was "bot related"
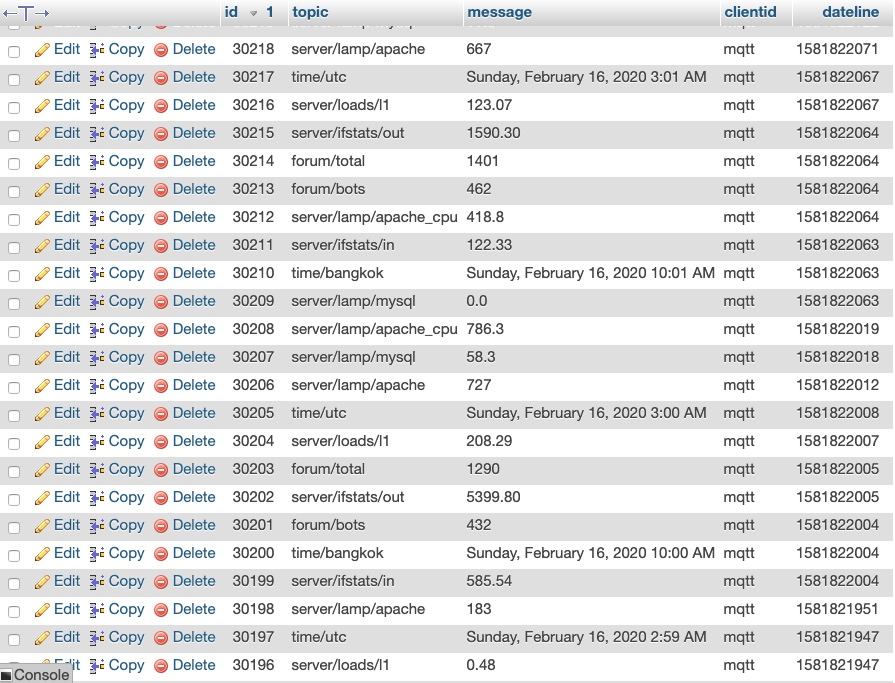
TImeline from my MQTT instrumentation logged in the DB:
text use unixmanpages; SET timestamp=1581684511;select os, token, query, manid,formatted,MATCH(text) AGAINST ('Arduino Project with NB-IoT (3GPP) and LoRa / LoRaWAN' IN NATURAL LANGUAGE MODE) as score,strlen FROM neo_man_page_entry where strlen > 2000 AND strlen < 1000000 ORDER BY score DESC limit 3, 1; So, if the next spike has a similar correlation to Apache2 processes and bots, I will build some "count which bots from who" instrumentation so see if we can find out "which bots are causing the problem"... but before I build instrumentation for that, let's see what happens during the next spike hit.
As I recall, this could be an issue with any number of bots (if this is indeed the cause), including Chinese bots, Korean bots, etc. However, I have seen Bingbot also cause similar issues before.
Yea! I have that "warm feeling" which comes from closing in on solving a mystery!
But on the other hand, I am not sure if the spike in Apache2 processes is a cause or an effect, because if the site slows down (for some reason), I think the Apache2 processes can take longer to change state and they could spike as an effect and not a cause.. Hopefully, will get this all figured out soon.
Note: If I execute the "slow query" above, now, that query takes one second. So the SQL query above is more-than-likely a coincidental effect.
This reminds me a strange issue we had going for months before I managed to prove it was Patrol related...
I never liked BMC Patrol as for me expensive and big CPU Hog... compared to much better vendors such as sysload...
What happened is that periodically something that should not happen does: all the Patrol system, Oracle etc requests fall at the same time... Could be the same here 2-3 bots with requests you see you believe innocent so dont bother when fall together can put high load... I would not make a fuss if it does not last long, but remember it can happen it could fall on a moment when the box is running at 100% and then its not quite the same
Exactly Victor,
It's not a big deal because the spikes are just for a minute 4 to 6 times a day; but the problem is when (potentially) all the "bad things" align all at once (bots, DB, system loads), and the one minute problem becomes a two or three minute problem (it's possible, of course).
I'm going to refine my instrumentation and see if I can figure it out. If so, great. Normally, I can solve most any system-level computer problem and with (more than) a bit of uncertainty in the new COVID-19 biohazard around these parts, I'm not so keen in going out with so many tourists here now (none of the foreign tourists are wearing masks, as I can see today, and there are a LOT of tourists now) ; so this little spike problem is keeping me busy inside, avoiding a potential virus from Chinese wildlife markets.
Glad you figured it out already.
What's regarding instrumentation, I found it very helpful once I had basic monitoring data available for all my servers. I'm still sticking to the solution, I'm knowing and using for many years now(check_mk, open source of course), as it is easy to handle, flexible to extend and with thousands of check plugins ready at hand if needed and lots of features available if you need to do more. So you have the basic metrics of your equipment in reach.
Some examples of many basic graphs I which you get ready configured out of the box:
Network Interface Usage
Memory/Swap Usage
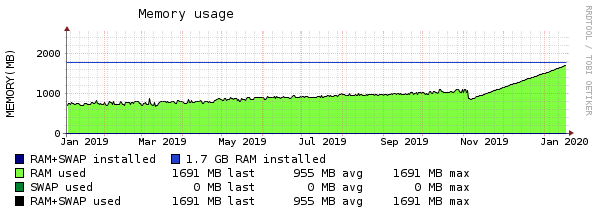
Filesystem grow and trending


So it's just a few clicks away to check and you'll get informed about all the basic stuff(disk full, memory full, cpu overloaded, network errors, ...), so you do not have to care for yourself in case of trouble and often you'll notice anomalies before it get's critical.
There maybe a lot of hot stuff out there like prometheus, netdata(demo), grafana(demo), ... but that far exceeds my needs and costs me too much - in terms of time and energy to get acquainted with - which I rather invest in other areas.
Those rrdtools based tools are quite efficient.
rrdtool is one of the gems in computing, much like MQTT Neo mentioned.
As for Prometheus, give it a shot, it's not that hard 
But i think we already discussed that in past, as long as <insert monitoring> works for you, that is what is most important.
But sometimes drill down is necessary when problem is less obvious and cannot be deduced from graphs.
Regards
Peasant.
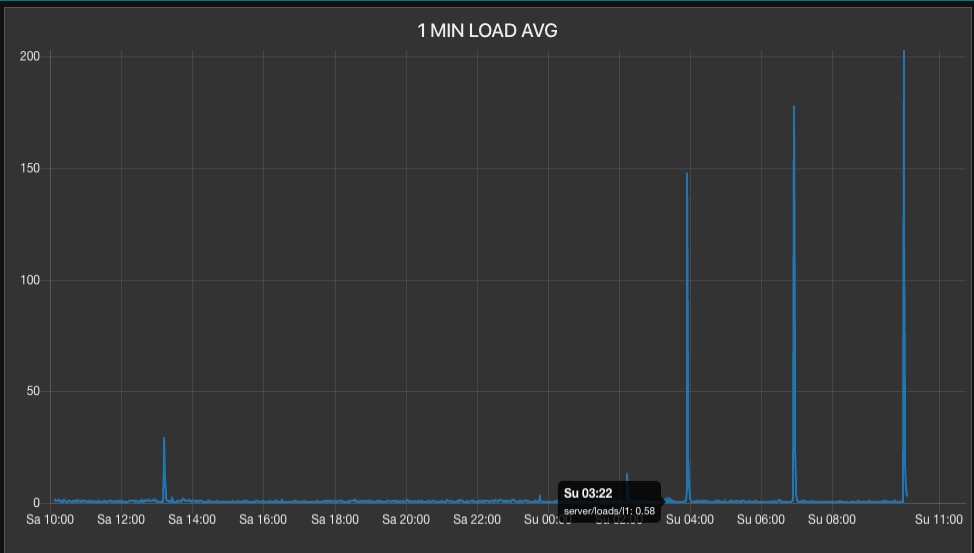
Update:
Two more spikes over the course of the past 12 hours, none of which show any correlation to an increase the number of bots; however, that does not say anything about the velocity of bots hitting the site. However, there is no correlation (over the last 12 hours and with two spikes recorded) with an increased overall number of bots. In addition, there is no correlation to increase network I/0.
The only consistent correlation so far is:
There is weak, but inconsistent, correlation with:
There is no correlation, weak or otherwise to:
So, as a sanity check, I have disabled apache2 mod pagespeed (just now) to see if there is any effect at all.
<IfModule pagespeed_module>
    # Turn on mod_pagespeed. To completely disable mod_pagespeed, you
    # can set this to "off".
    ModPagespeed off

    ###
    ###
This is just a "shot in the dark" (disabling mod pagespeed), but at least we will know something. If the spikes continue, I will turn it back on, of course.
Not yet.
Last night did not confirm the "rogue bots are the cause" .... hypothesis (see above post). Two more spikes, no correlation to increase bot number or network I/O. But I'm still looking into it ![]()
Regarding instrumentation, I prefer to build my own, like I have done with Node-RED and MQTT.
I like instrumentation which works for me; and not instrumentation designed by others. Believe me, I have used many "others" packages in the past, over decades.
Web based packages which run on the server we are observing start having problems when the server itself is having problems, so I do not use them.
That is why I use MQTT, so the only additional load requirement of the server when under stress is to publish a short message to the network (off platform). Installing packages on the same server being tested, especially web-based programs resident on servers being monitored which are primarily web servers, is not a good way to build instrumentation, in my view (so I don't do it and only recommend it in the most simple case).
MQTT is ideal for this kind of instrumentation. MQTT is free. MQTT is very easy to operate and maintain; and MQTT permits a wide-variety of ways to store data (on any node running MQTT in the network) and visualize the data (MQTT supported apps, anywhere on the network).
So, I do not have an instrumentation problem. The issue I have is trying to decide, based on evidence and strong correlation, what to monitor.
At the moment, I am testing apache2 mod pagespeed (have turned it off, temporarily). I may turn off XCache later (after the disable mod pagespeed test, and see if that changes things.
I am also very happy with Node-RED. In fact, I am extremely impressed with it.
Let me close with saying that I use MQTT and Node-RED by choice and do want want any other packages (I have used many of them over the decades). I really like MQTT and Node-RED. These tools fit my style and work great for me. For others, please use any instrumentation and monitor tools what work for you and / or supported by your organization.
Prometheus uses HTTP on the same server where HTTP is the main application under observation. This is from the Prometheus docs:
I'm not inclined to install an application which relies on HTTP at the data transport layer to monitor a LAMP application where HTTP and apache2 are at the core of the problem. However, for a different scenario, an HTTP-transport based monitoring system might be "just the ticket".
Thanks for the ideas, but I'm sticking with MQTT and Node-RED for the time being. MQTT is very lightweight on the server and it does not use HTTP; but instead uses a light-weight TCP connection, which I prefer, but that is just me.
I complete agree with you that:
Except I would change your second comment to read more like:
For all but the most trivial problems, we need to drill down into the system. Time series graphs and charts are only indicators. The story continues past indicators for all but the most trivial issues we encounter .......
I'm pretty sure you agree. After all, if we only needed third party time series graphing tools to solve problems, we could hire 12 year old kids to manage our networks and servers , and we could do other tasks more fun and interesting tasks ![]()
But on the other hand, when we work in network and system management (whatever we are doing or where ever we are working), we always encounter new and very interesting problems and the more complex networks become, the more interesting the problems are.
Update:
Did not help at all. Slowed the site down a bit and did not stop any spikes.
ModPagespeed on
Next:
I have some old "cyberspace situational awareness" PHP code I used for a visualization project a few years ago, which captures and stores details information on web session activity; this code has proven handy identifying rouge bots in the past.
So, I have modified that code to capture and store detailed session information, including the number of hits per IP address, the user agent string, country code, etc. when the 1 minute load average is above 20 and less than 50.
$theload = getLoadAvg();
if (floatval($theload) > 20.0 && floatval($theload) < 50.0)
{
  /// the old CSA code to parse web session activity and store the results in the DB
}
So, let's see what happens the next time we get a spike... this should be interesting.
mysql> describe neo_csa_session_manager;
+--------------+------------------+------+-----+---------+----------------+
| Field        | Type             | Null | Key | Default | Extra          |
+--------------+------------------+------+-----+---------+----------------+
| id           | int(11) unsigned | NO   | PRI | NULL    | auto_increment |
| user_id      | int(11)          | NO   | MUL | 0       |                |
| session_id   | varchar(255)     | NO   |     | NULL    |                |
| url          | text             | NO   |     | NULL    |                |
| ip_address   | varchar(45)      | NO   | MUL | NULL    |                |
| user_agent   | varchar(255)     | NO   |     | NULL    |                |
| bot_flag     | tinyint(1)       | NO   |     | 0       |                |
| robot_txt    | mediumint(6)     | NO   |     | 0       |                |
| sitemap      | mediumint(6)     | NO   |     | 0       |                |
| riskscore    | int(11)          | NO   |     | 0       |                |
| country_iso2 | varchar(2)       | NO   |     | UN      |                |
| country      | varchar(50)      | NO   |     | UNKNOWN |                |
| hitcount     | int(10) unsigned | NO   |     | 1       |                |
| firstseen    | bigint(11)       | NO   |     | NULL    |                |
| unixtime     | bigint(11)       | YES  |     | NULL    |                |
| longitude    | float            | NO   |     | 0       |                |
| latitude     | float            | NO   |     | 0       |                |
+--------------+------------------+------+-----+---------+----------------+
17 rows in set (0.00 sec)
Update:
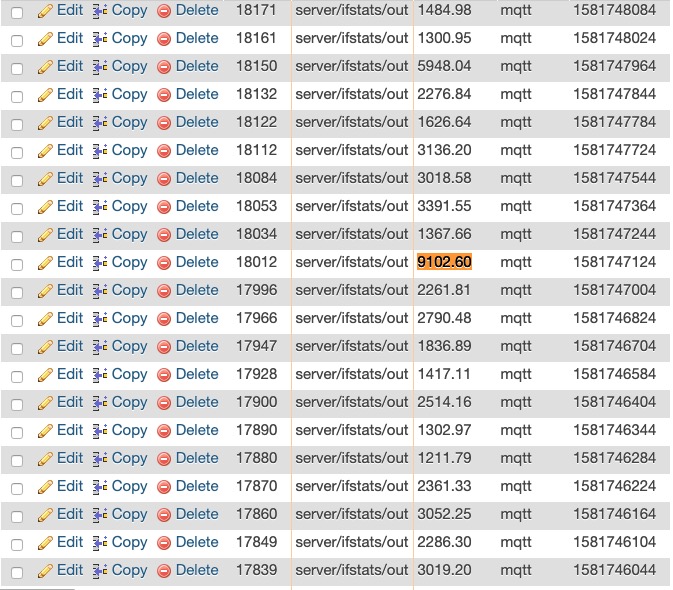
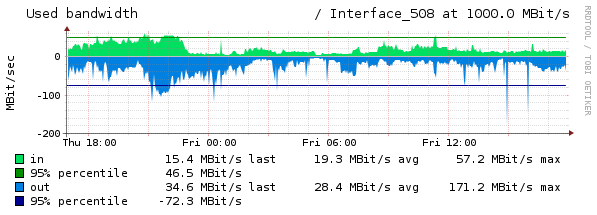
Just noticed, after digging around in the DB logs from my MQTT instrumentation, that the last spike correlated with a jump in data transferred out of the network interface:
Typical values are much less (see below), so this would seem to validate the "rouge bots hypothesis", currently leading the candidate to explain these periodic spikes:
This is also the first "hard correlation" of a spike with network interface iostats , so, let's see if my code in the post before this one will trap the next big spike
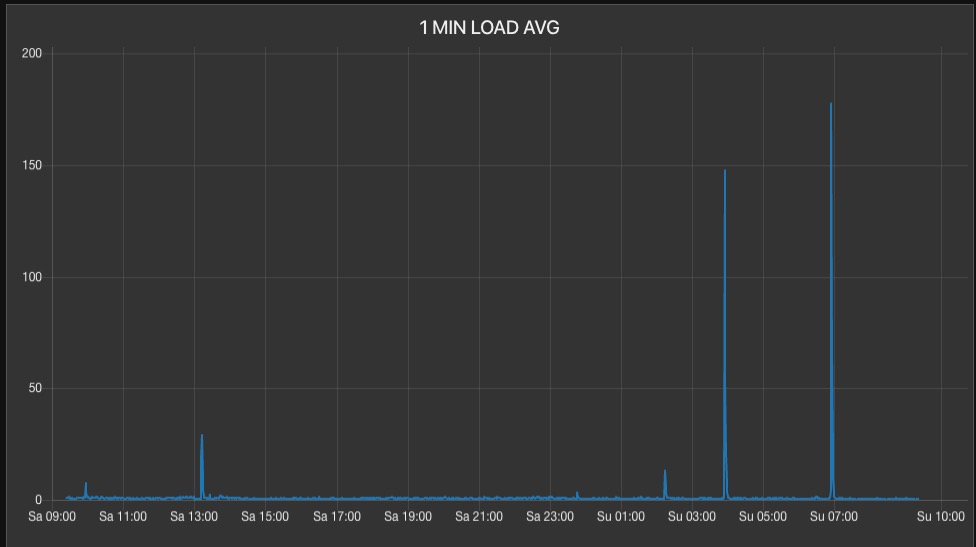
Update:
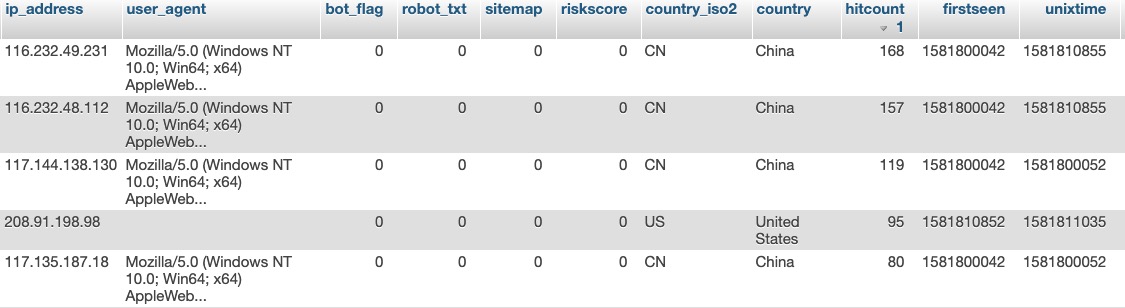
There were two spikes three hours apart; both were captured by my HTTP session logging program, which logs session detaisl aggregated by IP address. In this case, the code starts logging (kicks off) when the one minute load average exceeds 20 and ends when the same load average exceeds 50. So, in a spike we will record a very short snap shot in time of the traffic (on the way up and on the way down, but I may change this in the future to only capture on the way up).
The results were as follows:
In both spikes, there were at least fort Chinese IP addresses present at the top of the "hit count" chart (the DB table):
All four of these IP addresses were present during the 4AM and 7AM (Bangkok Time) spikes, and all three identified with the same user agent string:
Mozilla/5.0 (Windows NT 10.0; Win64; x64) AppleWebKit/537.36 (KHTML, like Gecko) Chrome/71.0.3578.98 Safari/537.36
This indicates these IP addresses (in China) are running the same bot software; but that is only an indication (but a fairly strong indication).
However, there is no denying that my "trap the bots" code has identified four Chinese IP addresses running some bot software which is more-than-likely contributing to the cause of the spikes.
In addition, during the same two spikes spaced three hours apart (as mentioned), there was one US-based IP address running with a blank user agent string:
Keep in mind in this capture, the code only captured the session information when the one minute load average was above 20 and below 50, and there were two spikes spaced almost exactly three hours apart:
So, having recorded the events above, I have just now emptied that DB table and have "reset the trap" for the next spikes.
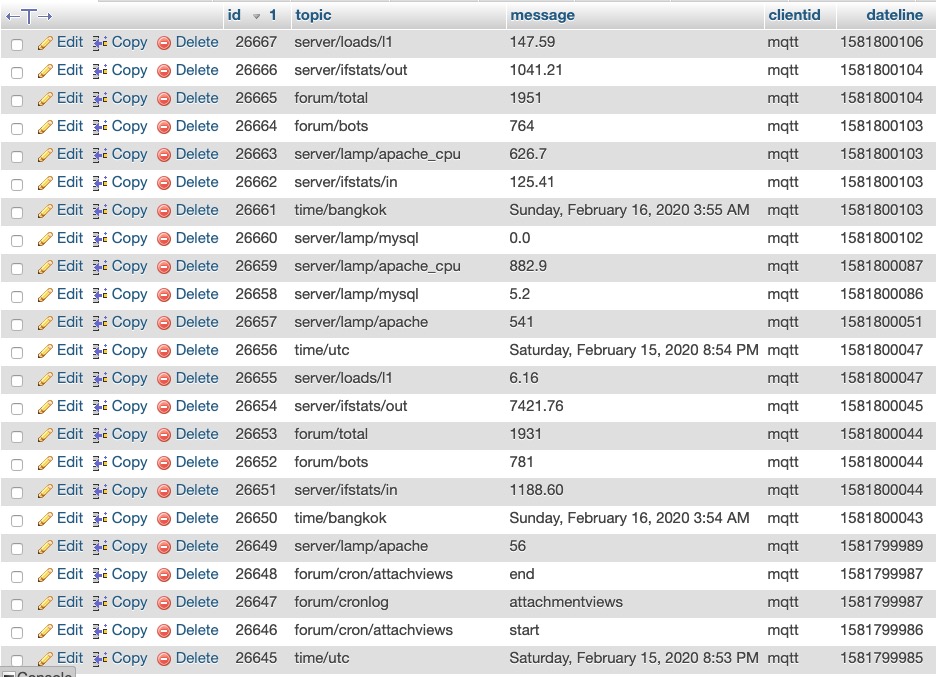
Now, turning our attention to my instrumentation log where I am using MQTT to log all application and system cron (batch) events (start and end times) as well as a number of system metrics, we see there is a correlation (during the first spike) at 1581800045 of a spike in traffic out of the network interface, along with correlating spikes in Apache2 processes and CPU.
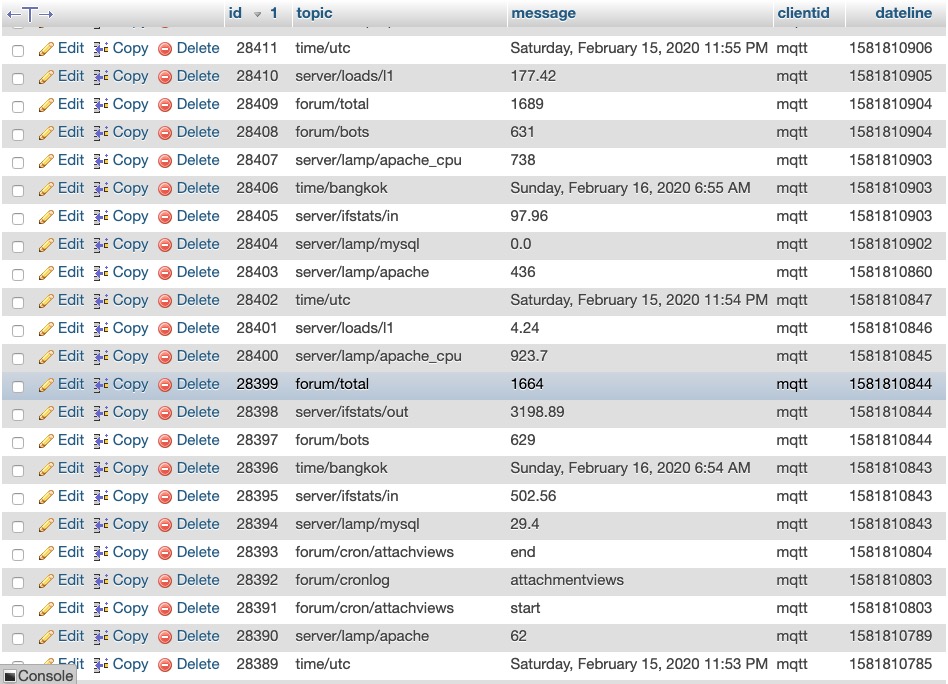
Now looking at the second event (spike 2), there is a similar pattern, but of interest in that proceeding both spikes, is an hourly application cron function:
This seems to indicate that the cause of the spikes, in this case, is a combination of aggressive bot activity coincidental with an hourly cron / batch process, causing spikes.
To be more certain of this, I am going to change the time of the "update attachment view" cron process from kicking off on the 53 minute mark of every hour, to the 23 minute mark of every hour, and see if the times of the spikes shift in time as well.