One of the great thing about unix is the ability to pipe multiple programs together to manipulate data. Plain, unstructured text is the most common type of data that is passed between programs, but these days JSON is becoming more popular.
I thought it would be fun to pipe together some command line JSON tools to do some stupid terminal tricks, like plotting a graph of system statistics, like CPU or memory utilization.
We can use jc (disclosure: I wrote jc), jq, and jp to pull the output of uptime and display a line graph like this:
In this post I'll show you how you can build a quick bar graph of the CPU utilization of the top processes right in the terminal. For more information on how to create the animated line graph above, see my blog post at blog.kellybrazil.com.
first, get jc, jq, and jp.
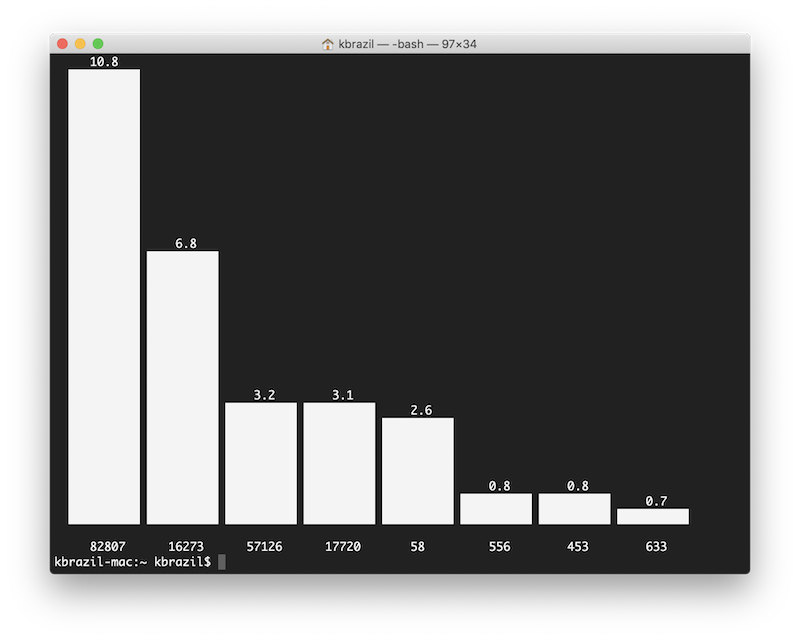
Then you can use this one-liner to graph the output of ps:
ps axu | jc --ps | jq '[.[] | select (.cpu_percent > 0.5)]' | jp -type bar -canvas full-escape -x ..pid -y ..cpu_percent
Fun stuff! jq is an awesome JSON tool for the cli and is a bit like sed or awk for JSON. You'll find lots of uses for manipulating JSON as more and more programs start to output in the format.