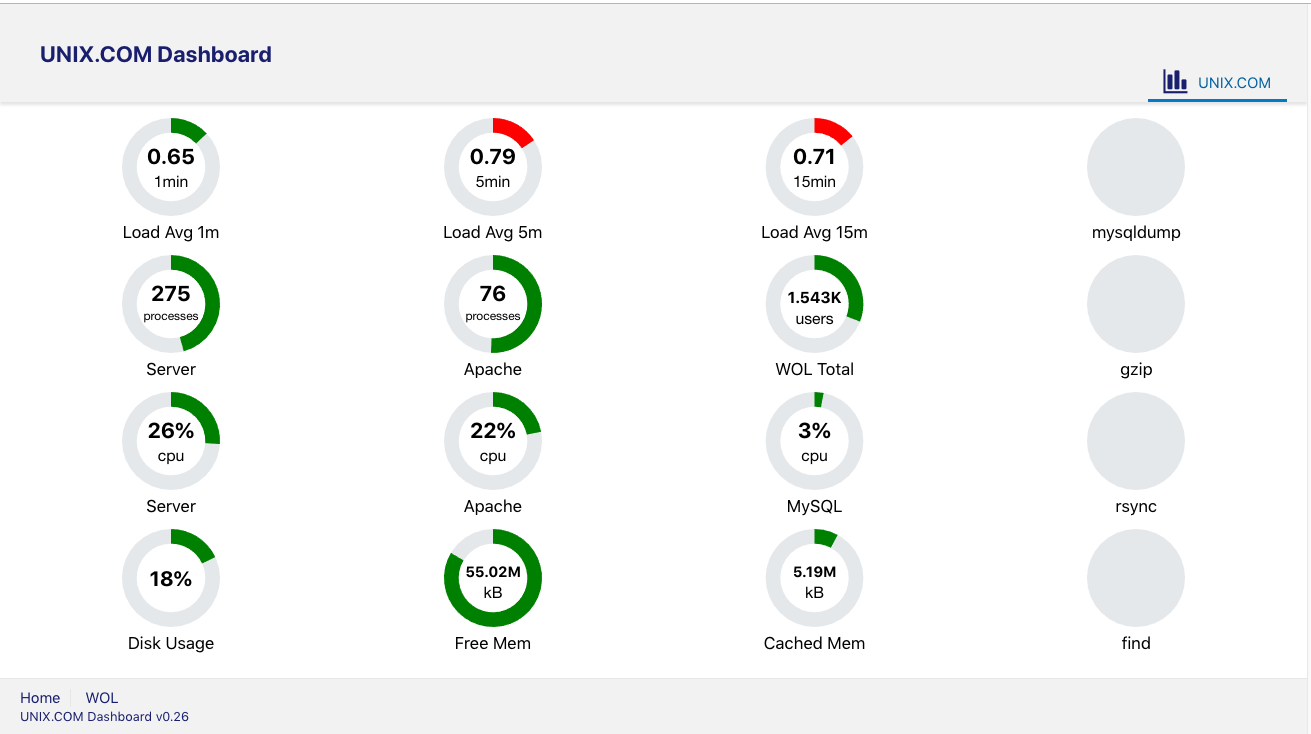
Creating a Simple Linux Dashboard with Oracle Jet - Part 1 the Server Side PHP Code
Creating a simple Linux dashboard with Oracle Jet is easy and fun. It's simple to create a dashboard to monitor your Linux server using Oracle JET. The sky is the limit with indicators and gauges.
Here is some very basic server side PHP code to build an Oracle JET dashboard. The code is not fully optimized, but should help anyone who wants to build a dashboard.
<?php

// anyway to start you request is fine.  In this script the $_GET request is not required.
// basically we build a JSON string from a number of simple Linux indicators:

if ($_GET['loadavg'] == '1') {
    $out = '{';
    $out .= getLoads();
    $out .= getLEDIndicator('mysqldump');
    $out .= getLEDIndicator('gzip');
    $out .= getLEDIndicator('find');
    $out .= getLEDIndicator('rsync');
    $out .= getdiskPercent('md2');
    $out .= getMem('MemFree');
    $out .= getMem('Cached');
    $out .= getprocessCPU('all');
    $out .= getprocessCPU('apache2');
    $out .= getprocessCPU('mysqld');
    $out .= getprocessCounts('apache2');
    $out .= getprocessCounts('rsync');
    $out .= '}';

    // on our server we have a  can_moderate() function that controls access to the JSON file
    // however, you can use any access control method you like:

    if (can_moderate()) {
        header('Access-Control-Allow-Origin: *');
        echo $out;
    }

}

// the functions are simple, and self explanatory and could be further combined
// but you get this idea:

function getprocessCounts($get = 'rsync')
{
    $target = 'ps aux | grep ' . $get . ' | grep -v grep | wc -l';
    $target_results = shell_exec($target);
    $output = ',"' . $get . 'count":"' . trim($target_results) . '"';

    return $output;
}

function getLoads()
{
    $string = file_get_contents('/proc/loadavg');
    $loadavg = explode(' ', $string);

    $n = 0;
    for ($n = 0; $n < count($loadavg); $n++) {
        $key = 'load' . $n;
        if ($n < count($loadavg) - 1) {
            $output .= '"' . $key . '":"' . trim($loadavg[$n]) . '",';
        } else {
            $output .= '"' . $key . '":"' . trim($loadavg[$n]) . '"';
        }

    }

    return $output;
}

function getLEDIndicator($get = 'apache2')
{
    $cmd = 'ps aux | grep ' . $get . ' | grep -v grep | wc -l';
    $cmd_results = shell_exec($cmd);
    $output = ',"' . $get . '":"' . trim($cmd_results) . '"';
    return $output;
}

function getdiskPercent($get = 'md2')
{
    $df = 'df | grep ' . $get . ' | grep -v grep';
    $df_results = shell_exec($df);
    $usage = preg_split('/\s+/', $df_results);
    $percent = explode('%', $usage[4]);
    $output = ',"' . $get . '":"' . trim($percent[0]) . '"';
    return $output;
}

function getMem($get = 'MemFree')
{
    $getMem = 'cat /proc/meminfo | grep ' . $get;
    $getMem_results = shell_exec($getMem);
    $mem = preg_split('/\s+/', $getMem_results);
    $output = ',"' . strtolower($get) . '":"' . trim($mem[1]) . '"';
    return $output;
}

function getprocessCPU($get = 'mysqld')
{
    $sum = 0;
    if ($get == 'all') {
        $doit = 'ps -eopcpu,comm';
    } else {
        $doit = 'ps -eopcpu,comm | grep ' . $get;
    }

    $results = shell_exec($doit);
    if ($get == 'all') {
        $clean = explode(' ', $results);
    } else {
        $clean = explode($get, $results);
    }

    foreach ($clean as $line) {

        if (s_has_letters(trim($line)) or trim($line) == '') {
            continue;}
        {
            if (strlen($line) > 0) {
                $sum += trim($line);
            }

        }
    }
    $output = ',"' . strtolower($get) . '":"' . trim($sum) . '"';
    return $output;
}

function s_has_letters($string)
{
    return preg_match('/[a-zA-Z]/', $string);
}
Here is some sample JSON output. Please note in a future update to this code I will update the loadavg names in the JSON to more accurately describe the indicators:
{
  "load0": "0.69",
  "load1": "0.57",
  "load2": "0.56",
  "load3": "1/291",
  "load4": "29704",
  "mysqldump": "0",
  "gzip": "0",
  "find": "0",
  "rsync": "0",
  "md2": "18",
  "memfree": "54970768",
  "cached": "5185620",
  "all": "39.5",
  "apache2": "35.8",
  "mysqld": "3.6",
  "apache2count": "93",
  "rsynccount": "0"
}
In the next post; I'll post the Oracle JET module, including the Javascript and HTML files.