Memory leak in Shell Script

Hello,

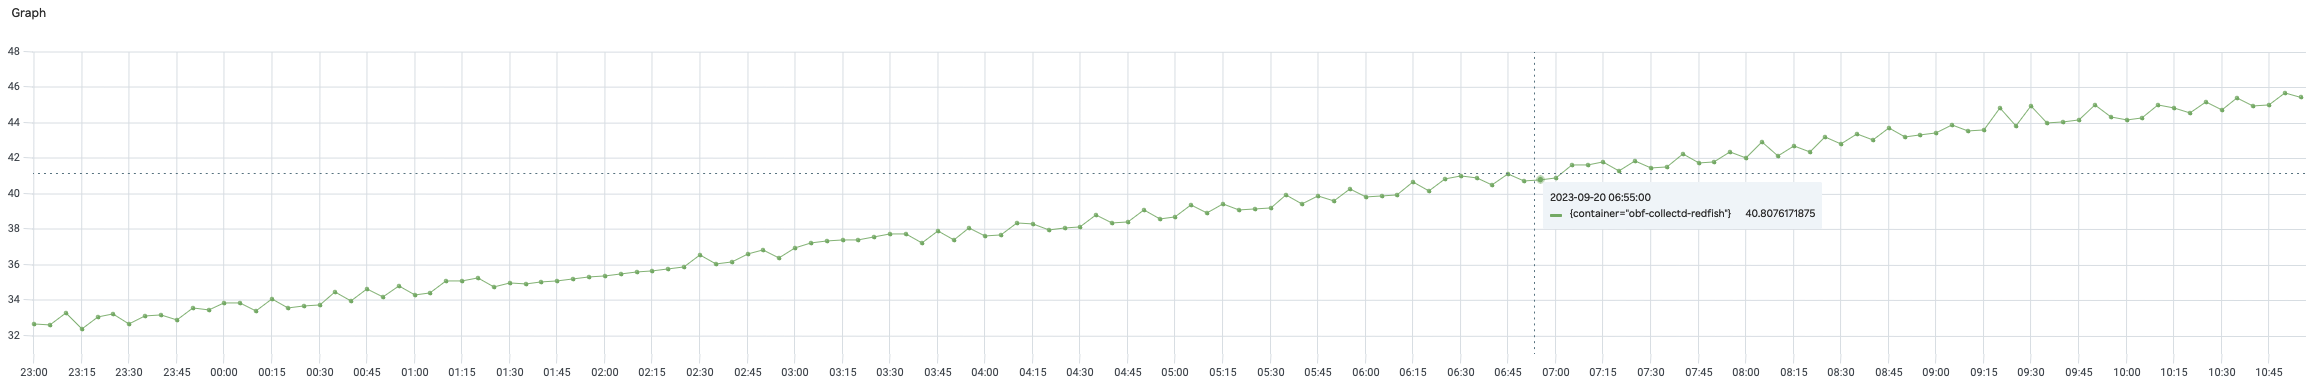
I am using below shell script which gets called in every one minute from crontab. But there is a continuous memory increase on container which causes restart due to that while there is no other process on system.
If somebody can help whats going wrong here OR Is there any issue when we schedule anything from Crontab using CentOS7.


#!/bin/bash

process_api_output() {
    local redfish_url="$1"
    local log_dir=${2:-"redfish"}
    local log_time=$(date +%d%b%y_%H)
    local log_dir_path="/log/$log_dir"
    local log_file="${log_dir_path}/redfish#uhn7.local#-${log_time}.log"
    local error_log_file="${log_dir_path}/redfish_error#uhn7.local#-${log_time}.log"
    local tmp_log_file="${log_dir_path}/redfish_tmp.log"
    chmod -R 777 ${log_dir_path}

    # Retrieve the API output directly without storing it in a variable
    local API_OUTPUT
    API_OUTPUT=$(curl --connect-timeout 20 --max-time 40 -g -vsS -k -u test:test -H 'Content-type:application/json' "$redfish_url" 2>> "$tmp_log_file")

    # Remove newline, carriage return, and form feed characters from the log file and append the error log
    tr -d '\n\r\f' < "$tmp_log_file" | tee -a "$error_log_file"

    # Remove the temporary log file
    rm "$tmp_log_file"

    # Process the API output and append it to the main log file along with the timestamp
    local API_OUTPUT_SUBSTR="${API_OUTPUT:1:-1}"

    echo "{$API_OUTPUT_SUBSTR,\"Logtime\":\"$(date)\"}" >> "$log_file"
    echo -e "\n" >> "$log_file"
    echo -e "\n" >> "$error_log_file"

    unset API_OUTPUT API_OUTPUT_SUBSTR
}


# Usage example:
process_api_output "https://[<ip>]/redfish/v1/Managers/Self/OemSensors"
process_api_output "https://[<ip>]/redfish/v1/Managers/Self/LogServices/SEL"
process_api_output "https://[<ip>]/redfish/v1/Managers/Self/LogServices/SEL/Entries"


timeout 30 ipmitool sdr list | grep  -i FPGA |awk '
BEGIN { ORS = ""; print "{ "}
{ printf "%s\"%s\" : \"%s\"",
      separator, $1, $3
  separator = ", "
}
END { print " } \n" }' >> /log/redfish/fpga#uhn7.local#-$(date +%d%b%y_%H)_test.log;


trim(){
   echo $@
}
OUTPUT=$(timeout 30 ipmitool -U admin -P 'xxxxx' raw 0x36 0x66 0x4c 0x1C 0x00 0x01)
DATE=$(date)
echo \{\"FAULT_LED\":\"`trim $OUTPUT`\",\"Logtime\":\"$DATE\"\}>> /log/redfish/fpga#uhn7.local#-$(date +%d%b%y_%H)_test.log

If you are running out of RAM memory, that would suggest that your cron jobs do not exit, so you add a new process to the container every minute.

You should be able to use ps -f -u yourUserName to see the jobs, their parents, and their start times.

You produce several log files. It might be worth examining those, showing anything relevant, adding some targeted debug. Also, showing the crontab entry would help.

If your container is running out of disk space, that would be a different line of enquiry.

You could schedule a simpler script from crontab to check it behaves itself. However, cron is used by the system itself, so it seems unlikely that there are issues with that part of the system. There should be a crond log, but I don't know where CentOS7 would put it -- maybe /var/log/cron.

2 Likes

Thanks @Paul_Pedant
But i am not seeing anything under process which keeps on piling & there is also no process coming with TOP which have memory usage -

top - 05:23:32 up 244 days, 13:30,  0 users,  load average: 29.40, 27.82, 30.97
Tasks:  11 total,   2 running,   9 sleeping,   0 stopped,   0 zombie
%Cpu(s): 27.4 us,  5.9 sy,  0.0 ni, 65.8 id,  0.3 wa,  0.0 hi,  0.6 si,  0.0 st
KiB Mem : 39412332+total, 17202201+free, 12089280+used, 10120851+buff/cache
KiB Swap:        0 total,        0 free,        0 used. 26398523+avail Mem 

   PID USER      PR  NI    VIRT    RES    SHR S  %CPU %MEM     TIME+ COMMAND                                                                                                                                                                 
177317 root      20   0   83272   3928   2948 R   1.7  0.0   0:00.05 curl                                                                                                                                                                    
     1 root      20   0   12312   1956   1040 S   0.0  0.0   0:00.16 bash                                                                                                                                                                    
    44 root      20   0   22824   1476    720 S   0.0  0.0   0:04.91 crond                                                                                                                                                                   
    45 root      20   0    4452    452    284 S   0.0  0.0   0:00.00 sleep                                                                                                                                                                   
 21956 root      20   0   12440   2388   1320 S   0.0  0.0   0:00.09 sh                                                                                                                                                                      
177124 root      20   0   12440   2368   1300 S   0.0  0.0   0:00.12 sh                                                                                                                                                                      
177201 root      20   0   72704   2428   1412 S   0.0  0.0   0:00.00 crond                                                                                                                                                                   
177204 root      20   0    9616   1516   1180 S   0.0  0.0   0:00.03 sh                                                                                                                                                                      
177298 root      20   0   56272   2168   1456 R   0.0  0.0   0:00.01 top                                                                                                                                                                     
177316 root      20   0    9616    756    420 S   0.0  0.0   0:00.00 sh                                                                                                                                                                      
269433 root      20   0   12444   2388   1320 S   0.0  0.0   0:00.11 sh                     

ps -f -u root

UID         PID   PPID  C STIME TTY          TIME CMD
root          1      0  0 Sep18 ?        00:00:00 /bin/bash -c /root/redfish_entrypoint.sh; while true; do sleep infinity; done;
root         44      1  0 Sep18 ?        00:00:04 /usr/sbin/crond
root         45      1  0 Sep18 ?        00:00:00 sleep infinity
root      21956      0  0 Sep19 pts/1    00:00:00 sh
root     178006     44  0 05:27 ?        00:00:00 /usr/sbin/CROND
root     178008 178006  0 05:27 ?        00:00:00 sh /root/redfish.sh
root     178103      0  0 05:27 pts/2    00:00:00 sh
root     178142 178008  0 05:27 ?        00:00:00 sh /root/redfish.sh
root     178143 178142  2 05:27 ?        00:00:00 curl --connect-timeout 20 --max-time 40 -g -vsS -k -u                  -H Content-type:application/json https://[240b:c020]/redfish/v1/Managers/Self/LogServic
root     178144 178103  0 05:27 pts/2    00:00:00 ps -f -uroot
root     269433      0  0 Sep19 pts/0    00:00:00 sh

I also tried to check/get crond logs but seems there is no directory available into the system for that.

Memory Trend in percentage -

The Memory Trend image is interesting. Obviously the peaks represent memory usage by processes that is being recovered. The underlying trend can be isolated by laying a ruler across the screen which touches only the lowest points. It turns out that these are in an exact straight line.

For example, that baseline on the graph crosses the 34 GB line at 00:40, and the 36 GB line at 02:35. We lose 2 GB in 115 minutes, a rock-steady 17.8 MB per minute.

That memory has to belong to processes started by crontab. Maybe Centos does not show defunct jobs that are not yet collected. But having a Bash process as Pid 1 may be the culprit for this.

The process with Pid 1 has certain responsibilities. It is the parent of the entire process tree. As such, any child process whose parent exits gets reparented under Pid 1. Pid 1 is responsible for waiting for such processes, and collecting their exit status.

I also notice that Kernel (PPID 0) is the parent of four processes -- 1, 21956, 178103, and 269433. That seems irrational.

Having a bash script as Pid 1 is a problem.

/bin/bash -c /root/redfish_entrypoint.sh; while true; do sleep infinity; done;

Pid 1 is not allowed to exit. Presumably that is what the sleep inf is for. But if that does not also have a trap to process SIGCHLD, processes will never be culled.

I suspect the script there is intended to be launched asynchronously (with &), and that command line will then run forever. It should collect defunct children.

This is complicated by Bash itself, which (apparently) does not need to wait for child processes. It actively culls them, and caches up the return data so that when the script eventually uses wait, Bash already has the information.

I also note the load average: 29.40, 27.82, 30.97 on the top output. These measure scheduler queue length as an indirect measure of system load (nothing to do with CPU load). Those numbers should probably not exceed 5.0, so they indicate someting very unusual.

The cron log directory I suggested seems to be the default for Centos, but the system is very configurable. You might look at this, which has Centros-specific info. If you do amend the configuration, you might need to restart the crond service to pick up the changes.

Alternative scenario. I do not know exactly what Memory Trend is measuring.

At the time you took the top data, there was 17 GB free, and 10 GB cache.

The cache can be made available almost instantaneously (the data is already also on disc), so the Available memory is 26 GB.

Your original post mentions "memory increase on container which causes restart". What exactly implements that ? It does not seem to be the OOM process.

I conjecture that both the Memory Trend and the restart mechanism are working directly off the Free memory value.

In that case, setting up a cron job that drops caches every hour might solve this issue (that would limit the cache growth to 1 GB). The effect should be plainly visible on the Memory Trend output.

Thanks @Paul_Pedant for reply.
So let me put more details to clearify on this -

We have a Container running with 400MB memory allocation where it runs some steps like below -

  • Run entrypoint.sh under argument like below, its in infinte sleep so that container does not exit-
- args:
    - /root/redfish_entrypoint.sh; while true; do sleep infinity; done;
    command:
    - /bin/bash
    - -c
    env:
    - name: IS_IPV4
      value: "false"

redfish_entrypoint.sh -

#!/bin/sh

cp /root/redfish/redfish.sh /root/redfish.sh
chmod 777 /root/redfish.sh


if [ $IS_IPV4 == "true" ] ;  then
 export BMC_IP_V6=$(ipmitool lan  print | grep -A 2 'IP Address' | grep 'Address              :' | awk '{print $4}')
else
  if [ $IS_IPV6_DYNAMIC_ADDRESS == "true" ] ;  then
     ...
 else
     ...
 fi
fi
sed -i ...
sed -i ...

echo "${REDFISH_JOB_CRON} sh /root/redfish.sh" | crontab -
crontab -l | { cat; echo "${REDFISH_JOB_CRON} find /hostfs/var/log/collectd/redfish/ -type f -mtime +1 -exec rm -f {} \;"; } | crontab -
crontab -l | { cat; echo "${REDFISH_JOB_CRON} find /hostfs/var/log/collectd/cortex/ -type f -mtime +1 -exec rm -f {} \;"; } | crontab -
crontab -l | { cat; echo "${REDFISH_JOB_CRON} find /hostfs/var/log/collectd/redfish/ -size +10M | xargs rm -f {} \;"; } | crontab -

/usr/sbin/crond

Now Crontab calls 4 command every minute in which one is calling of redfish.sh.

redfish.sh -

#!/bin/bash

process_api_output() {
    local redfish_url="$1"
    local log_dir=${2:-"redfish"}
    local log_time=$(date +%d%b%y_%H)
    local log_dir_path="/log/$log_dir"
    local log_file="${log_dir_path}/redfish#uhn7.local#-${log_time}.log"
    local error_log_file="${log_dir_path}/redfish_error#uhn7.local#-${log_time}.log"
    local tmp_log_file="${log_dir_path}/redfish_tmp.log"
    chmod -R 777 ${log_dir_path}

    # Retrieve the API output directly without storing it in a variable
    local API_OUTPUT
    API_OUTPUT=$(curl --connect-timeout 20 --max-time 40 -g -vsS -k -u test:test -H 'Content-type:application/json' "$redfish_url" 2>> "$tmp_log_file")

    # Remove newline, carriage return, and form feed characters from the log file and append the error log
    tr -d '\n\r\f' < "$tmp_log_file" | tee -a "$error_log_file"

    # Remove the temporary log file
    rm "$tmp_log_file"

    # Process the API output and append it to the main log file along with the timestamp
    local API_OUTPUT_SUBSTR="${API_OUTPUT:1:-1}"

    echo "{$API_OUTPUT_SUBSTR,\"Logtime\":\"$(date)\"}" >> "$log_file"
    echo -e "\n" >> "$log_file"
    echo -e "\n" >> "$error_log_file"

    unset API_OUTPUT API_OUTPUT_SUBSTR
}


# Usage example:
process_api_output "https://[<ip>]/redfish/v1/Managers/Self/OemSensors"
process_api_output "https://[<ip>]/redfish/v1/Managers/Self/LogServices/SEL"
process_api_output "https://[<ip>]/redfish/v1/Managers/Self/LogServices/SEL/Entries"


timeout 30 ipmitool sdr list | grep  -i FPGA |awk '
BEGIN { ORS = ""; print "{ "}
{ printf "%s\"%s\" : \"%s\"",
      separator, $1, $3
  separator = ", "
}
END { print " } \n" }' >> /log/redfish/fpga#uhn7.local#-$(date +%d%b%y_%H)_test.log;


trim(){
   echo $@
}
OUTPUT=$(timeout 30 ipmitool -U admin -P 'xxxxx' raw 0x36 0x66 0x4c 0x1C 0x00 0x01)
DATE=$(date)
echo \{\"FAULT_LED\":\"`trim $OUTPUT`\",\"Logtime\":\"$DATE\"\}>> /log/redfish/fpga#uhn7.local#-$(date +%d%b%y_%H)_test.log

Now when we are talking about memory trend, its like below where it shows memory in Bytes.. so currently its approaching around 200MB out of 400MB. Once it reaches to 400MB then container gets killed because of OOM which is obvious.
Now the pain point is as its a normal script why it keeps on increasing memory.

ps -f -u root

UID         PID   PPID  C STIME TTY          TIME CMD
root          1      0  0 Sep18 ?        00:00:00 /bin/bash -c /root/redfish_entrypoint.sh; while true; do sleep infinity; done;
root         44      1  0 Sep18 ?        00:00:04 /usr/sbin/crond
root         45      1  0 Sep18 ?        00:00:00 sleep infinity
root      21956      0  0 Sep19 pts/1    00:00:00 sh
root     178006     44  0 05:27 ?        00:00:00 /usr/sbin/CROND
root     178008 178006  0 05:27 ?        00:00:00 sh /root/redfish.sh
root     178103      0  0 05:27 pts/2    00:00:00 sh
root     178142 178008  0 05:27 ?        00:00:00 sh /root/redfish.sh
root     178143 178142  2 05:27 ?        00:00:00 curl --connect-timeout 20 --max-time 40 -g -vsS -k -u                  -H Content-type:application/json https://[240b:c020]/redfish/v1/Managers/Self/LogServic
root     178144 178103  0 05:27 pts/2    00:00:00 ps -f -uroot
root     269433      0  0 Sep19 pts/0    00:00:00 sh

Having crontab fire the same script every minute is pretty intensive. Do you know beyond any shadow of a doubt that the previous run will have finished before the next one is fired? If not, then should the script be waiting on resources, e.g. a file lock or a network socket or whatever, then you will have a pile up. Also, remember that a cron environment is not the same as your command line environment.

Yes, I'm repeating what @Paul_Pedant has already suggested.

Is it properly configured to fire every minute? Please post your exact cron line entry.

Have you thoroughly tested and measured the elapsed time for a run? Is it getting stuck?

If your production process will allow I would be inclined to adjust the firing to every five minutes and see if the problem goes away.

If previous one is not finished before next fired then it should be visible in process list.
I watched continuously ps -ef output and there is no process piled up which gets fired through cron.

Crontab entry -

sh-5.1# crontab -l
* * * * * sh /root/redfish.sh
* * * * * find /hostfs/var/log/collectd/redfish/ -type f -mtime +1 -exec rm -f {} \;
* * * * * find /hostfs/var/log/collectd/cortex/ -type f -mtime +1 -exec rm -f {} \;
* * * * * find /hostfs/var/log/collectd/redfish/ -size +10M | xargs rm -f {} \;

This is buggy, filenames with a space are mistreated and deletion of a {} filename is attempted.
Suggested improvement:
echo "${REDFISH_JOB_CRON} find /hostfs/var/log/collectd/redfish/ -size +10M -mmin +60 -exec rm -f {} \;
It still can delete open files, and processes can continue writing to them.
It can cause a problem if disk space in the container is mapped to memory on the host.
Check the fs type and size with
df -T /hostfs/var/log/collectd/redfish/

Check /proc/meminfo, preferrably on the host. Which memory type is increasing?

2 Likes

I obviously do not understand containerisation, to the extent that I don't trust anything we are measuring.

Your top output relates to the whole server: been up 244 days, KiB Mem : 39412332+total (so 39.4 GB), 12089280+used (so 12 GB).

Then it shows only 11 tasks, whose resident memory total is 21 MB. Your container is stated to be 400 MB.

I don't see any evidence that shows any growth in memory by any of those processes.

I also cannot see anything that specifies the Memory Trend is in any specific units. If it is in %age of the container, does it actually reach 100% (-ish) when it is terminated? Obviously, it works in 5-minute resolution, which is pretty inadequate for monitoring a one-minute cron task with multiple children.

It would be informative if every task logged its begin and end times, name, pid and ppid.

I also see from the redfish_entrypoint.sh section that you in fact run four concurrent tasks every minute (not one as previously stated). I assume REDFISH_JOB_CRON (which is not declared anywhere I can see) is like * * * * * root. Also, that crond runs sh, so you run this script behind /bin/bash -c, and then it has a shebang for /bin/sh.

Note the script redfish.sh is explicitly run by sh, which will ignore the #!/bin/bash in the script itself.

It also appears to set up tasks to find and remove (every minute) files that have been modified two or more days previously.

redfish.sh also runs three calls of process_api_output consecutively. So the curl --connect-timeout 20 --max-time 40 safeguards are useless -- that every-minute cron will allow the consecutive curls to overstay their welcome.

I'm not sure why you need to update crontab four times, rather than just put the commands in a HereDoc and create the file once. It would simplify the quoting too.

Thanks @Paul_Pedant @MadeInGermany
I got some points here, let me try those and update here accordingly.

This topic was automatically closed 14 days after the last reply. New replies are no longer allowed.