Hi everyone
I am using the awk command to plot the coverage depth and I can generate the plot. However, while I am trying to provide label names for both axis it is not working.
here is the cmd line that I am using. Please let me know if you have any suggestions.
awk '{OFS="\t"; print $2, $3}' JC_nodup_Sample_002.txt | gnuplot -e "set terminal png; set output 'coverage_histogram_002_v2.png'; plot '-' with lines"
This command I used to plot
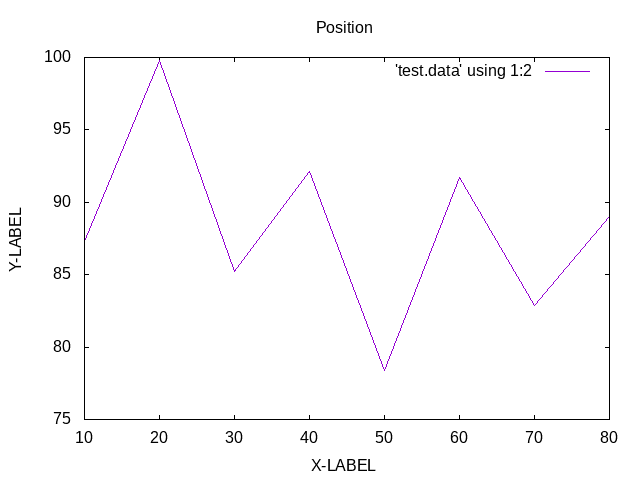
and this command I am using to give the headings
awk '{OFS="\t"; print $2, $3}' JC_nodup_Sample_002.txt | gnuplot -e "set terminal png; set output 'coverage_histogram_002_v2.png'; set xlabel 'X_Label'; set ylabel 'Y_Label'; plot '-' using 1:2 with lines title 'Position', '' using 1:3 with lines title 'Coverage Depth'"
Please let me know where I am making a mistake.
Thanks in advance.