After setting up MQTT and testing some ESP8266 and ESP32 modules, where I noted that testing in Programming ESP32 (ESP-WROOM-32) as an MQTT Client Subscribed to Linux Server Load Average Messages, I was so impressed with MQTT that I installed MQTT on three different computers, instantly and permanently.
MQTT is so easy to set up and start publishing alerts and small messages in pub/sub style that I searched around for a good dashboard app for the desktop and then I found Node-RED. Wow. Node-RED is very impressive free software. Thank you MQTT and Node-RED!
But of course, Node-RED is for folks comfortable with Node.js, NPM, Javascript; so if you are comfortable with at least those three technologies, getting Node-RED up and running quickly should be a piece of cake, otherwise YMMV.
Taking a break from my Arduino testing and proof-of-concept projects, I installed the following (with three MQTT servers / brokers already up and running). These node manager packages are easily found, well maintained and easy to install (easy to Google). Just make sure you install each component in your main Node-Red directory. Also, if you get confused on where to edit the few config files (based on your installation - mine was on macOS), make sure you look at your terminal logs when you start Node-RED. It's all there, the paths to settings for the js files, etc.
So, I installed these three packages:
- Node-RED . (
sudo npm install -g --unsafe-perm node-red) - Node-RED Dashboard (
npm i node-red-dashboard) - Midnight Node-RED Theme (
npm install node-red-contrib-theme-midnight-red)
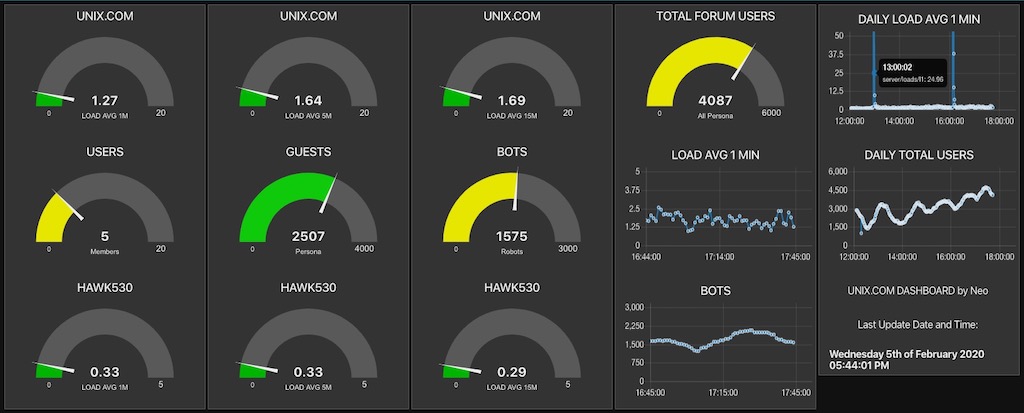
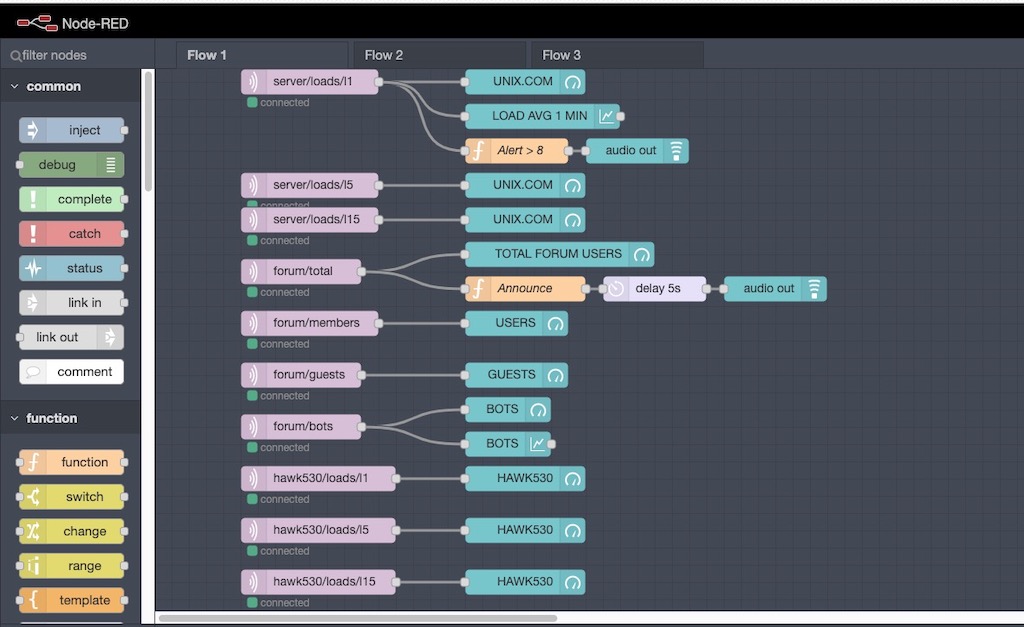
After about a hour of getting used to the layout and core features, reading some online docs when I got stuck (the usual way, dive right in and Google when you hit a roadblock), I got the following dashboard working, mostly flawlessly. Keep in mind that was my first attempt, so that's really impressive software! I may do a video on this combo, MQTT and Node-RED.
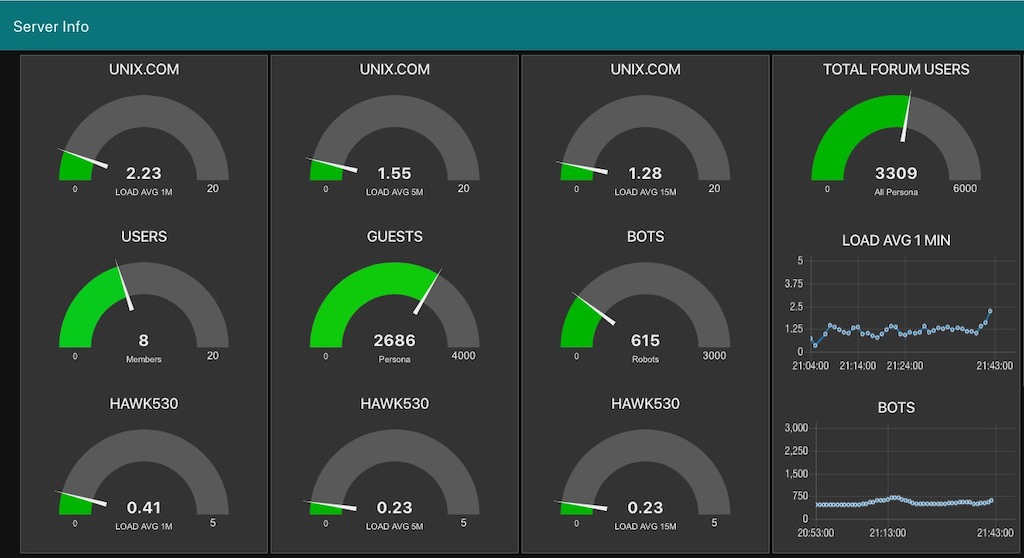
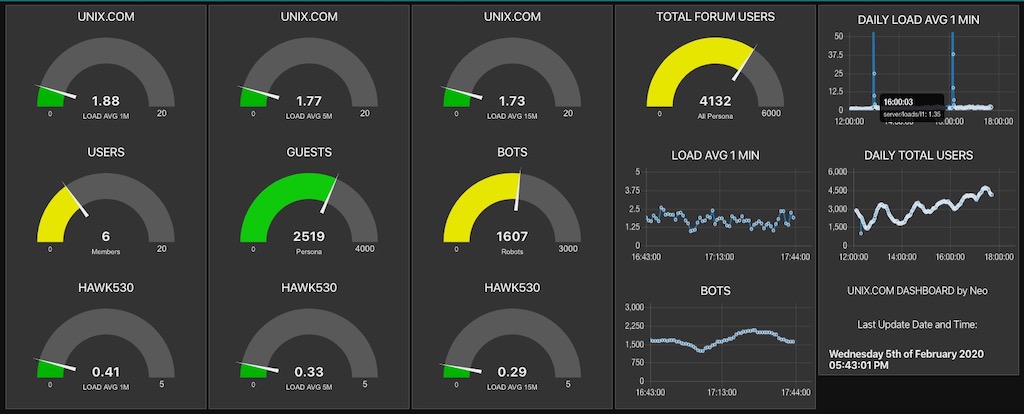
Here is what my first Node-RED dashboard project looked like (so far):
It's funny. The part I like the best at the moment is the female Australian voice announcing the total number of online users every minute (hope my wife does not get jealous!).
Anyway, this It's just great! In fact, between MQTT and Node-RED, this is a truly life changing event, haha. MQTT opens up every device to talk to every other device. I had no idea there was such great, free pub/sub software available which can be set up on a server, up and running, in five minutes. This is truly remarkable.
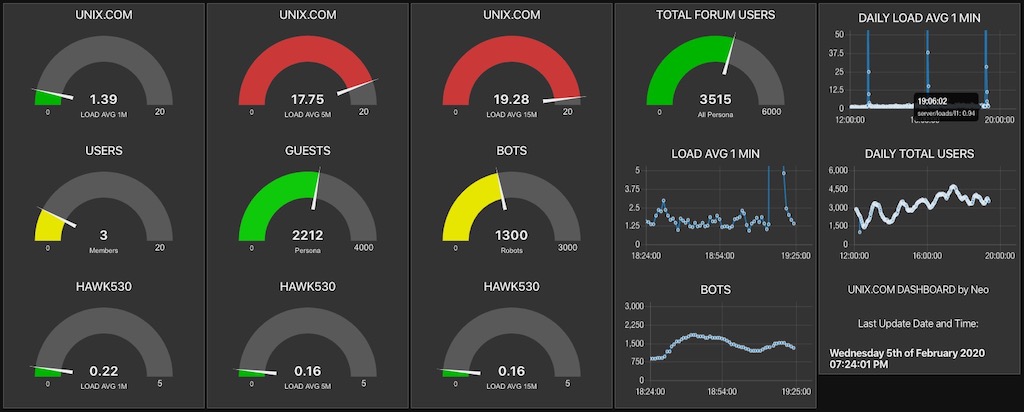
You can see from the time series graph how bots can really load down the site:
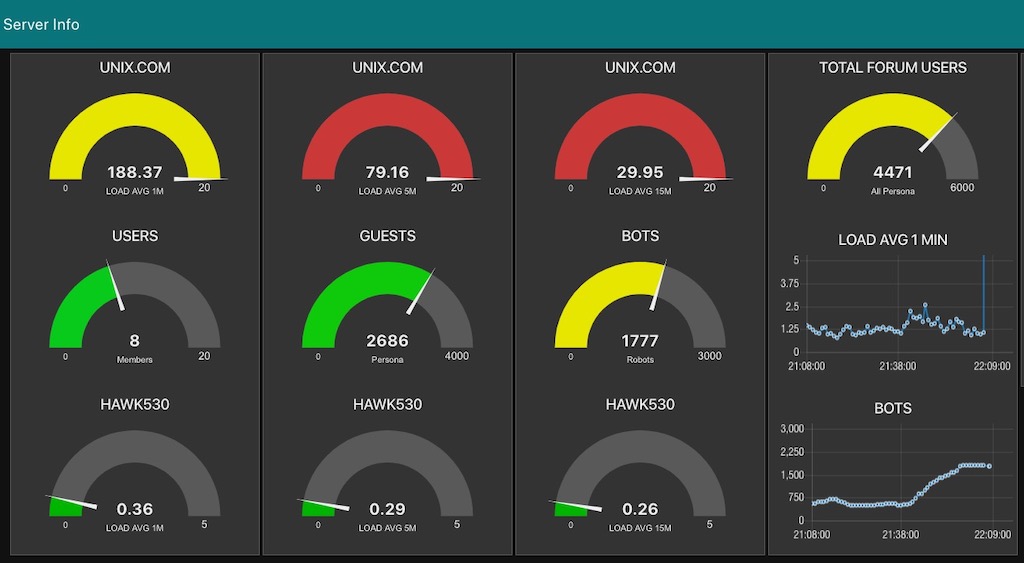
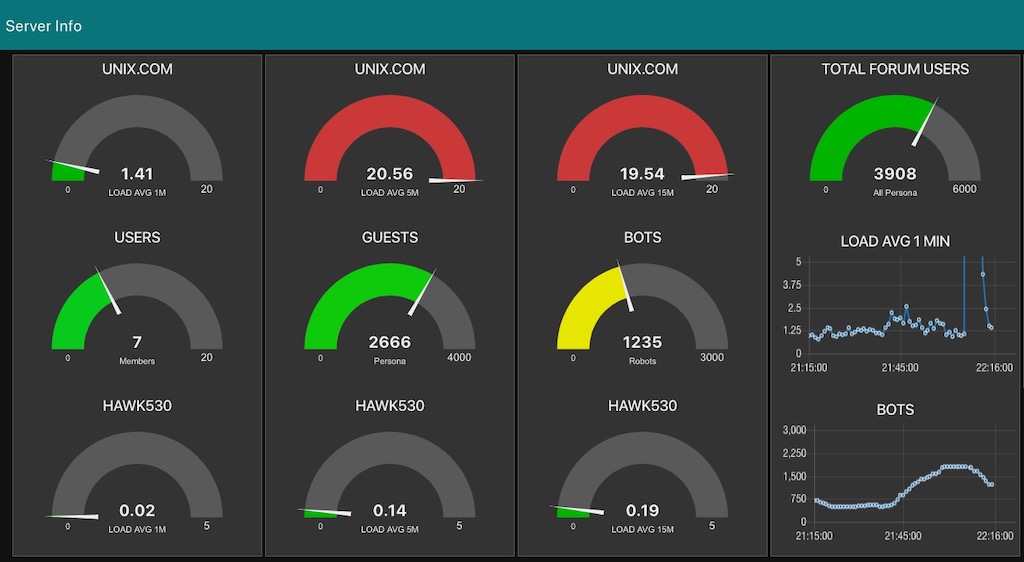
But I have some code which sends the bots to the "403 bit bucket" when the load goes crazy; and I adjusted them down and a few minutes later:
In fact, as I was writing this post.... when the nice Australian lady announced "UNIX LOAD AVERAGE IS 181", and combined with the Node-RED time series graph, I adjusted a few parameters and all went back to normal.
There is one more MQTT package from NASA , called the NASA Open MCT. Have you heard of it? Building an IoT dashboard with NASA Open MC . I will try this package and see how it works before getting back into Arduino modules and programming small devices. Then I'll use MQTT on the ESP devices (and maybe on my NB-IoT shield as well) to send sensor data from various modules to my MQTT broker and display in some nice dashboard widgets.
All in a days work!
Cheers!