Sneak Preview: New UNIX.COM UserCP VueJS Demo

Hey,

Now that I'm caught-up on a number of forum tasks, I can turn my attention to the next-generation UserCP (and learn VueJS) for the site.

Today I created this (not yet functional) demo using Vue;

https://www.unix.com/cp/index.php

What do you think?

6 Likes

Quite nice - the visual side of it... Looks cool...

Hello
Everything is great, only the theme I would change.
I would prefer the controls and the background to be of the same neutral color. For example. The background color of the menu is highlighted unnecessarily. How also buttons and so on. It distracts from the essence. In general, would prefer a smaller color play.
This is just my personal opinion, sorry and thanks.

1 Like

Current working on a switch to toggle light and dark mode, but it's not working yet so I cannot demo.

There is a lot of work to do; so I would not be worried about "colors" very much at this point in time, if I were you :slight_smile:

That is the easy part, LOL

1 Like

OK... I have the Dark / Light mode working in the prototype, thanks to the developer of the Vue.js template I am using to get started; and will upload a new "Sneak Peek" sooner than later and let everyone know.

Mock-Update:

Here are a few pics and a link to Vue Black Dashboard (UserCP) Mockup Prototype V0.02 with the switch for dark and light mode, etc:

https://www.unix.com/cp/index.php

You might need to completely quit your browser app and restart it to get the new version to load (due to some caching issue):

1 Like

Update: Version Mockup 0.03

Vue Black Dashboard Mockup v0.03

https://www.unix.com/cp/index.php
  • Removed world map (for now) because of "responsive issues" on mobile.
  • Added localStorage() to save "dark / light" mode switch and "sidebar background color selection".
  • Changed link to /cp/index.com temporarily due to some strange PHP issue.

Code (new SidebarSharePlugin.vue code in red):

<script>
import { BaseSwitch } from "src/components";

export default {
  name: "sidebar-share",
  components: {
    BaseSwitch
  },
  props: {
    backgroundColor: String
  },
  data() {
    return {
      sidebarMini: true,
      darkMode: true,
      isOpen: false,
      sidebarColors: [
        { color: "primary", active: false, value: "primary" },
        { color: "vue", active: true, value: "vue" },
        { color: "info", active: false, value: "blue" },
        { color: "success", active: false, value: "green" },
        { color: "warning", active: false, value: "orange" },
        { color: "danger", active: false, value: "red" }
      ]
    };
  },
  methods: {
    toggleDropDown() {
      this.isOpen = !this.isOpen;
    },
    closeDropDown() {
      this.isOpen = false;
    },
    toggleList(list, itemToActivate) {
      list.forEach(listItem => {
        listItem.active = false;
      });
      itemToActivate.active = true;
    },
    changeSidebarBackground(item) {
      this.$emit("update:backgroundColor", item.value);
      this.toggleList(this.sidebarColors, item);
      localStorage.setItem("sidebarbg", item.value);
    },
    toggleMode(type) {
      let docClasses = document.body.classList;
      if (type) {
        docClasses.remove("white-content");
        localStorage.setItem("mode", "dark-content");
      } else {
        docClasses.add("white-content");
        localStorage.setItem("mode", "white-content");
      }
    },
    minimizeSidebar() {
      this.$sidebar.toggleMinimize();
    }
  },
  mounted() {
    let modeSwitch = document.getElementById("dark-mode");
    if (localStorage.getItem("mode")) {
      if (localStorage.getItem("mode") == "white-content") {
        document.body.classList.add("white-content");
        modeSwitch.classList.add("bootstrap-switch-off");
      } else if (localStorage.getItem("mode") == "dark-content") {
        document.body.classList.remove("white-content");
        modeSwitch.classList.add("bootstrap-switch-on");
      }
    }
    let sidebarBg = document.getElementById("sidebar-bg");
    if (localStorage.getItem("sidebarbg")) {
      this.$emit("update:backgroundColor", localStorage.getItem("sidebarbg"));
    }
  }
};
</script>
2 Likes

Wowww, Woww, Wowww. This is simply AWESOME. You ROCK Neo.

Thanks,
R. Singh

1 Like

LOL... yes, I know.... ROTFL

Thanks for the compliment, Ravinder.

This solution has a long way to go yet. I'm mocking up the template now, step-by-step and coding new features as I go.

1 Like

Vue Black Dashboard Mockup v0.04

https://www.unix.com/cp/index.php
  • Simple mockups for login, registration, patreon pages including quick formatting and bg image changes, etc.

Hi Neo,

To use a local (Currently Glasgow UK) superlative - "most fandabidozi"! An excellent preview and I can only guess how much work must have gone into it, I cant wait to see it in full operation.

Just Awesome and a big thanks from me!

Regards

Gull04

1 Like

Thanks.

I don't think it was working property 30 minutes ago. I was loading a new Vue build which loaded chart data from the server directly into browser localStorage() and I forgot to create the JS script to write the data; but I have since fixed it. Try it now :slight_smile:

See next post:

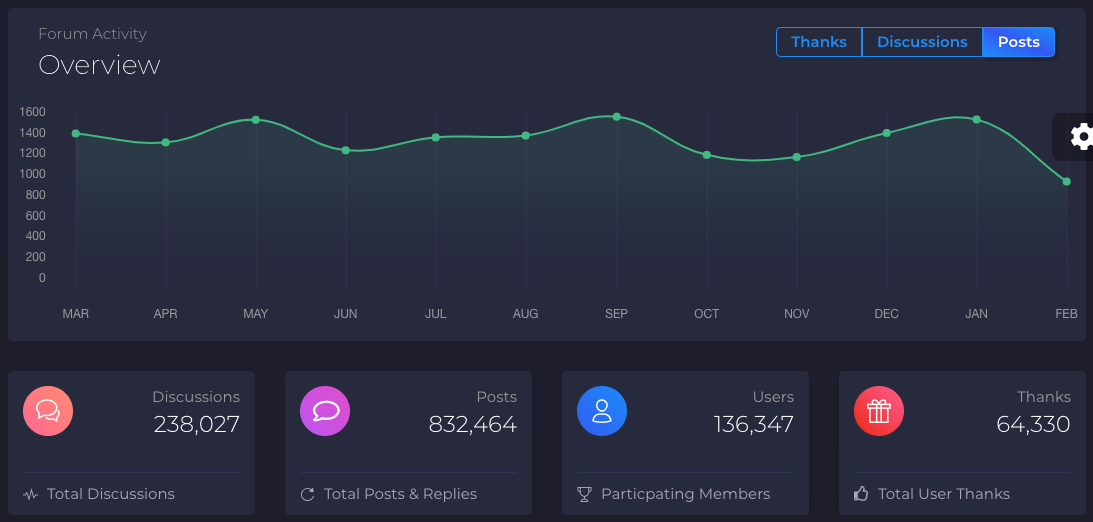
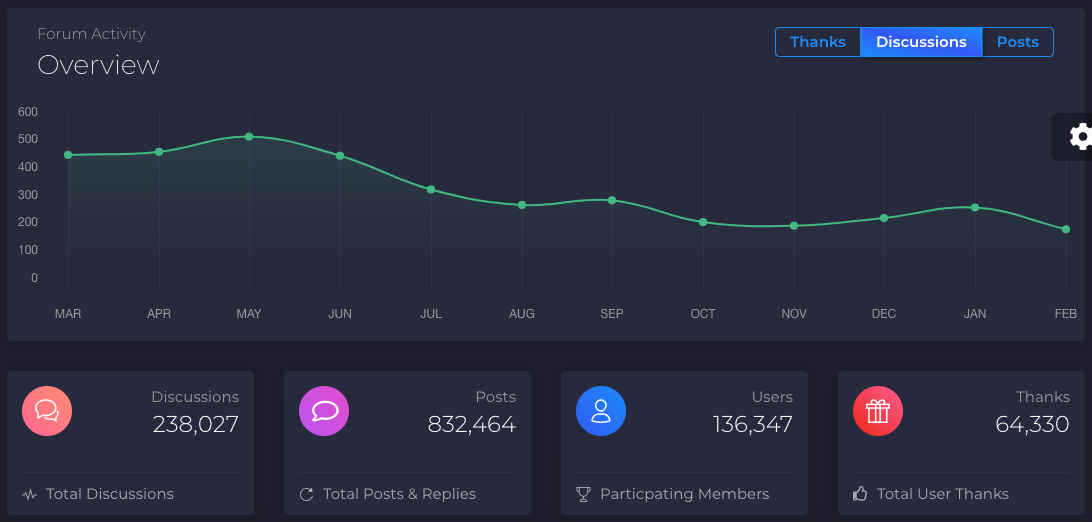
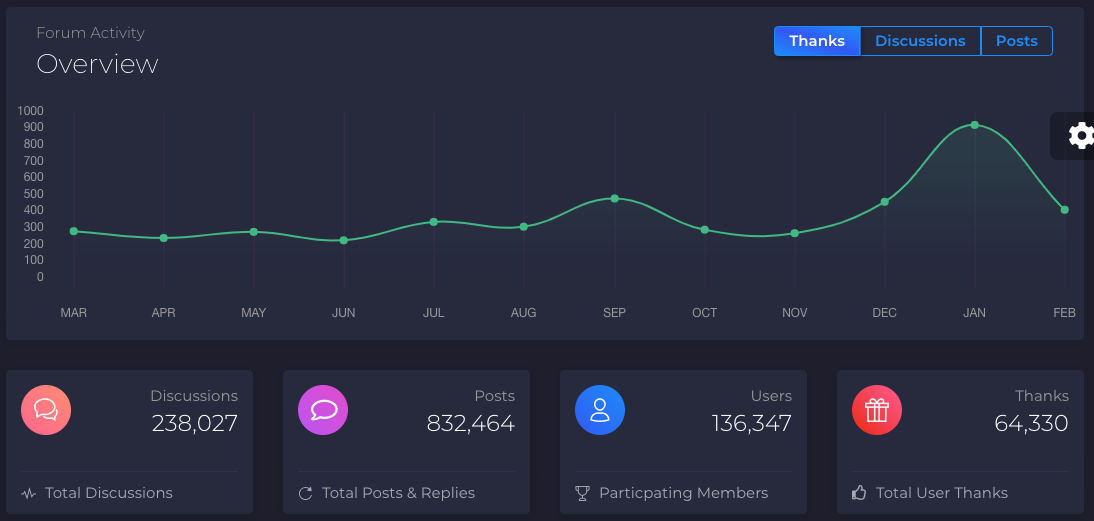
Vue Black Dashboard Mockup v0.05

https://www.unix.com/cp/index.php
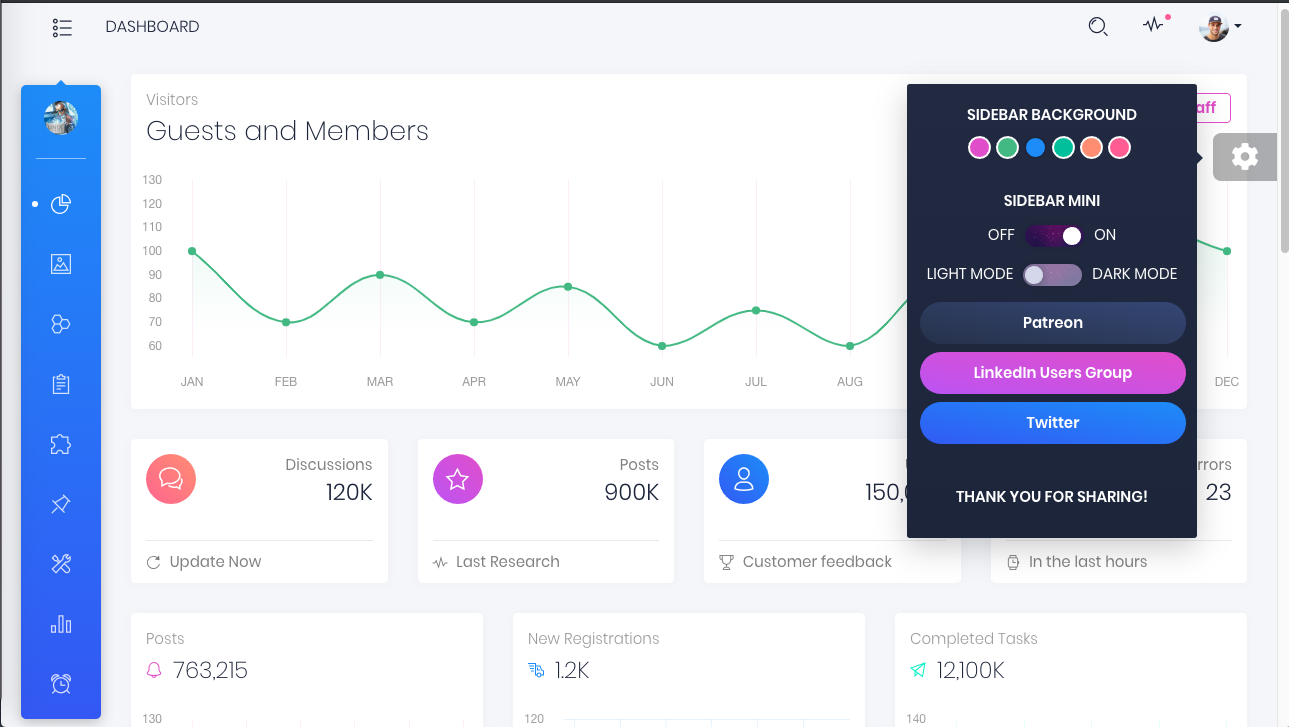
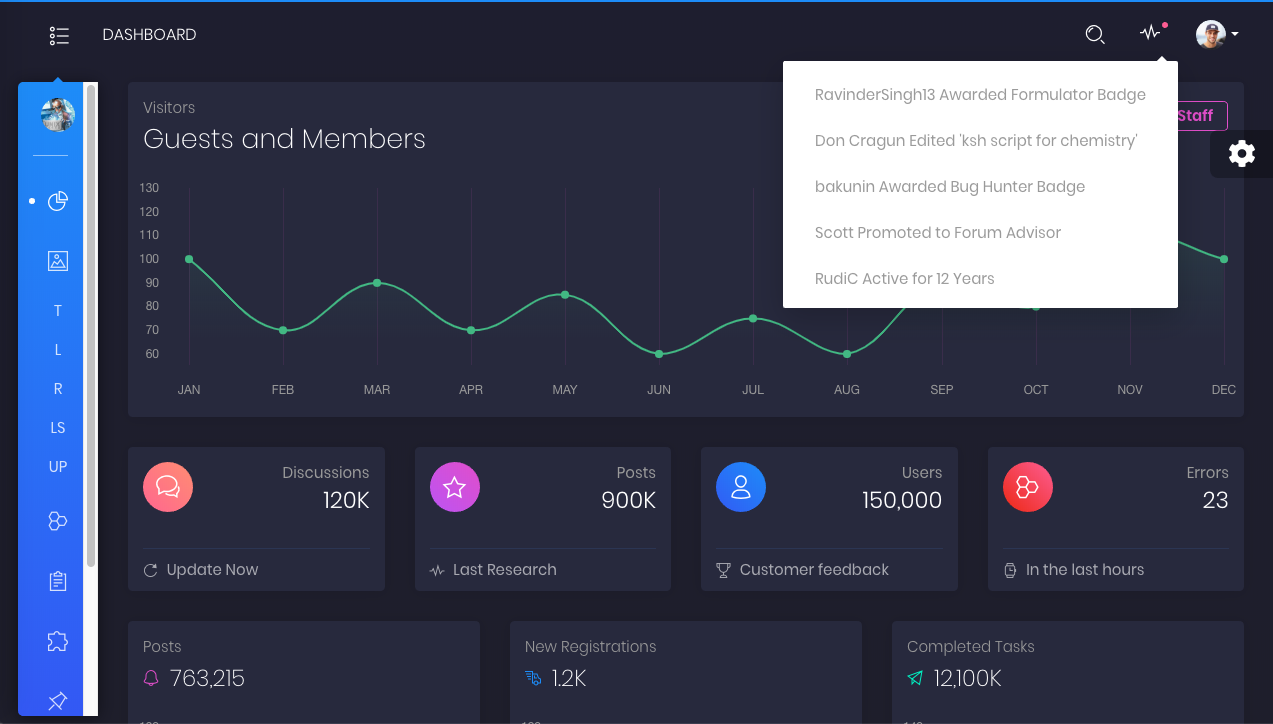
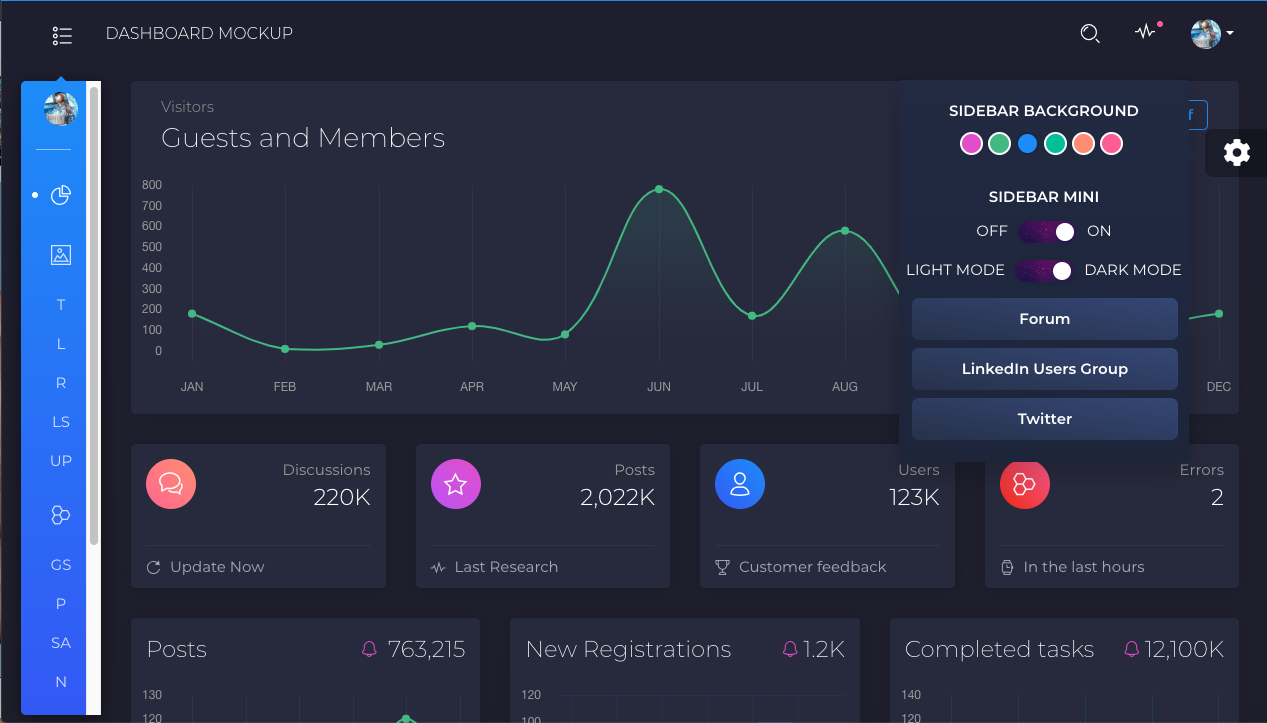
  • Now loading Guests and Members chart and Discussions, Posts, Users and Errors stats badges from localStorage() created on the server on the PHP side;

sample data from forums I created for this mockup:

<script>
let online = [
    {
      "jan": "180",
      "feb": "10",
      "mar": "30",
      "apr": "120",
      "may": "80",
      "jun": "780",
      "jul": "170",
      "aug": "580",
      "sep": "80",
      "oct": "280",
      "nov": "130",
      "dec": "180"
    },
    {
      "jan": "10",
      "feb": "100",
      "mar": "11",
      "apr": "121",
      "may": "23",
      "jun": "78",
      "jul": "17",
      "aug": "58",
      "sep": "2",
      "oct": "80",
      "nov": "13",
      "dec": "80"
    },
    {
      "jan": "80",
      "feb": "101",
      "mar": "20",
      "apr": "140",
      "may": "60",
      "jun": "80",
      "jul": "70",
      "aug": "50",
      "sep": "0",
      "oct": "28",
      "nov": "30",
      "dec": "80"
    }
  ];
  let summary = [
    {
      "threads": "220K",
      "posts": "2,022K",
      "users": "123K",
      "errors": "2"
    }
  ];
  localStorage.setItem('online',JSON.stringify(online));
  localStorage.setItem('summary',JSON.stringify(summary));
</script>

Dashboard.vue (new code in red):

Very simple and crude way to get data from localStorage() into the Vue dashboard mockup:

<script>
import LineChart from "@/components/Charts/LineChart";
import BarChart from "@/components/Charts/BarChart";
import * as chartConfigs from "@/components/Charts/config";
import TaskList from "./TaskList";
import UserTable from "./UserTable";
import CountryMapCard from "./CountryMapCard";
import StatsCard from "src/components/Cards/StatsCard";
import config from "@/config";

export default {
  components: {
    LineChart,
    BarChart,
    StatsCard,
    TaskList,
    CountryMapCard,
    UserTable
  },
  data() {
    return {
      statsCards: [
        {
          title: JSON.parse(localStorage.getItem("summary"))[0].threads,
          subTitle: "Discussions",
          type: "warning",
          icon: "tim-icons icon-chat-33",
          footer: '<i class="tim-icons icon-refresh-01"></i> Update Now'
        },
        {
          title: JSON.parse(localStorage.getItem("summary"))[0].posts,
          subTitle: "Posts",
          type: "primary",
          icon: "tim-icons icon-shape-star",
          footer: '<i class="tim-icons icon-sound-wave"></i></i> Last Research'
        },
        {
          title: JSON.parse(localStorage.getItem("summary"))[0].users,
          subTitle: "Users",
          type: "info",
          icon: "tim-icons icon-single-02",
          footer: '<i class="tim-icons icon-trophy"></i> Customer feedback'
        },
        {
          title: JSON.parse(localStorage.getItem("summary"))[0].errors,
          subTitle: "Errors",
          type: "danger",
          icon: "tim-icons icon-molecule-40",
          footer: '<i class="tim-icons icon-watch-time"></i> In the last hours'
        }
      ],
      bigLineChart: {
        allData: [
          [
            JSON.parse(localStorage.getItem("online"))[0].jan,
            JSON.parse(localStorage.getItem("online"))[0].feb,
            JSON.parse(localStorage.getItem("online"))[0].mar,
            JSON.parse(localStorage.getItem("online"))[0].apr,
            JSON.parse(localStorage.getItem("online"))[0].may,
            JSON.parse(localStorage.getItem("online"))[0].jun,
            JSON.parse(localStorage.getItem("online"))[0].jul,
            JSON.parse(localStorage.getItem("online"))[0].aug,
            JSON.parse(localStorage.getItem("online"))[0].sep,
            JSON.parse(localStorage.getItem("online"))[0].oct,
            JSON.parse(localStorage.getItem("online"))[0].nov,
            JSON.parse(localStorage.getItem("online"))[0].dec
          ],
          [
            JSON.parse(localStorage.getItem("online"))[1].jan,
            JSON.parse(localStorage.getItem("online"))[1].feb,
            JSON.parse(localStorage.getItem("online"))[1].mar,
            JSON.parse(localStorage.getItem("online"))[1].apr,
            JSON.parse(localStorage.getItem("online"))[1].may,
            JSON.parse(localStorage.getItem("online"))[1].jun,
            JSON.parse(localStorage.getItem("online"))[1].jul,
            JSON.parse(localStorage.getItem("online"))[1].aug,
            JSON.parse(localStorage.getItem("online"))[1].sep,
            JSON.parse(localStorage.getItem("online"))[1].oct,
            JSON.parse(localStorage.getItem("online"))[1].nov,
            JSON.parse(localStorage.getItem("online"))[1].dec
          ],
          [
            JSON.parse(localStorage.getItem("online"))[2].jan,
            JSON.parse(localStorage.getItem("online"))[2].feb,
            JSON.parse(localStorage.getItem("online"))[2].mar,
            JSON.parse(localStorage.getItem("online"))[2].apr,
            JSON.parse(localStorage.getItem("online"))[2].may,
            JSON.parse(localStorage.getItem("online"))[2].jun,
            JSON.parse(localStorage.getItem("online"))[2].jul,
            JSON.parse(localStorage.getItem("online"))[2].aug,
            JSON.parse(localStorage.getItem("online"))[2].sep,
            JSON.parse(localStorage.getItem("online"))[2].oct,
            JSON.parse(localStorage.getItem("online"))[2].nov,
            JSON.parse(localStorage.getItem("online"))[2].dec
          ]
        ],
        activeIndex: 0,
        chartData: null,
        extraOptions: chartConfigs.purpleChartOptions,
        gradientColors: config.colors.primaryGradient,
        gradientStops: [1, 0.4, 0],
        categories: []
      },
      purpleLineChart: {
        extraOptions: chartConfigs.purpleChartOptions,
        chartData: {
          labels: ["JUL", "AUG", "SEP", "OCT", "NOV", "DEC"],
          datasets: [
            {
              label: "Data",
              fill: true,
              borderColor: config.colors.primary,
              borderWidth: 2,
              borderDash: [],
              borderDashOffset: 0.0,
              pointBackgroundColor: config.colors.primary,
              pointBorderColor: "rgba(255,255,255,0)",
              pointHoverBackgroundColor: config.colors.primary,
              pointBorderWidth: 20,
              pointHoverRadius: 4,
              pointHoverBorderWidth: 15,
              pointRadius: 4,
              data: [80, 100, 70, 80, 120, 80]
            }
          ]
        },
        gradientColors: config.colors.primaryGradient,
        gradientStops: [1, 0.2, 0]
      },
      greenLineChart: {
        extraOptions: chartConfigs.greenChartOptions,
        chartData: {
          labels: ["JUL", "AUG", "SEP", "OCT", "NOV"],
          datasets: [
            {
              label: "My First dataset",
              fill: true,
              borderColor: config.colors.danger,
              borderWidth: 2,
              borderDash: [],
              borderDashOffset: 0.0,
              pointBackgroundColor: config.colors.danger,
              pointBorderColor: "rgba(255,255,255,0)",
              pointHoverBackgroundColor: config.colors.danger,
              pointBorderWidth: 20,
              pointHoverRadius: 4,
              pointHoverBorderWidth: 15,
              pointRadius: 4,
              data: [90, 27, 60, 12, 80]
            }
          ]
        },
        gradientColors: [
          "rgba(66,134,121,0.15)",
          "rgba(66,134,121,0.0)",
          "rgba(66,134,121,0)"
        ],
        gradientStops: [1, 0.4, 0]
      },
      blueBarChart: {
        extraOptions: chartConfigs.barChartOptions,
        chartData: {
          labels: ["USA", "GER", "AUS", "UK", "RO", "BR"],
          datasets: [
            {
              label: "Countries",
              fill: true,
              borderColor: config.colors.info,
              borderWidth: 2,
              borderDash: [],
              borderDashOffset: 0.0,
              data: [53, 20, 10, 80, 100, 45]
            }
          ]
        },
        gradientColors: config.colors.primaryGradient,
        gradientStops: [1, 0.4, 0]
      }
    };
  },
  computed: {
    enableRTL() {
      return this.$route.query.enableRTL;
    },
    isRTL() {
      return this.$rtl.isRTL;
    },
    bigLineChartCategories() {
      return [
        { name: "Guests", icon: "tim-icons icon-single-02 text-primary" },
        { name: "Members", icon: "tim-icons icon-gift-2 text-primary" },
        { name: "Staff", icon: "tim-icons icon-tap-02 text-primary" }
      ];
    }
  },
  methods: {
    initBigChart(index) {
      let chartData = {
        datasets: [
          {
            fill: true,
            borderColor: config.colors.primary,
            borderWidth: 2,
            borderDash: [],
            borderDashOffset: 0.0,
            pointBackgroundColor: config.colors.primary,
            pointBorderColor: "rgba(255,255,255,0)",
            pointHoverBackgroundColor: config.colors.primary,
            pointBorderWidth: 20,
            pointHoverRadius: 4,
            pointHoverBorderWidth: 15,
            pointRadius: 4,
            data: this.bigLineChart.allData[index]
          }
        ],
        labels: [
          "JAN",
          "FEB",
          "MAR",
          "APR",
          "MAY",
          "JUN",
          "JUL",
          "AUG",
          "SEP",
          "OCT",
          "NOV",
          "DEC"
        ]
      };
      this.$refs.bigChart.updateGradients(chartData);
      this.bigLineChart.chartData = chartData;
      this.bigLineChart.activeIndex = index;
    }
  },
  mounted() {
    this.i18n = this.$i18n;
    if (this.enableRTL) {
      this.i18n.locale = "ar";
      this.$rtl.enableRTL();
    }
    this.initBigChart(0);
  },
  beforeDestroy() {
    if (this.$rtl.isRTL) {
      this.i18n.locale = "en";
      this.$rtl.disableRTL();
    }
  }
};
</script>

I am now ready to pull this data live from the server MySQL DB with PHP and store the results in browser localStorage() with Javascript.

Getting close to having a full stack solution to build the dashboard :slight_smile: . Just call me:

Mr. Super Full Stack Web Dev Guy ... LOL

1 Like

Update:

I have noticed in the logfiles that a few users are trying to access the new cool dashboard but are having issues.

Guess what they all had in common :slight_smile:

Firefox.

This new code all makes heavy use of javascript and javascript localStorage() and unless you are a really experienced FF user who can debug all the "FF blocking and filtering of JS, etc), you will probably not have any luck viewing the cool new dash mockup.

I strongly suggest you use Chrome. Chrome works flawlessly "out of the box" without any tweeks.

Actually for me it works on Chrome, Safari, Opera and Firefox and here his the summary of each:

  • Chrome: Flawless
  • Opera: Flawless
  • Firefox: Works fine if you really know how to whitelist and permit Javascript and localStorage().
  • Safari: Works OK, but there are some formatting errors issues related to Bootstrap which are not resolved.

I cannot stress enough to everyone, please browse this site with Chrome (or Safari).

I have four browsers configured. Even if you LOVE Firefox for some historical or hysterical reason, you can run more than one browser.

Firefox breaks (filters and blocks by default) many Javascript features, so unless you are really an expert at understanding how to configure and test FF to get it to work (like Chrome, a great browser); most people do not know how to configure and do not use their built in web dev tools to debug.

I highly recommend you browser this site with CHROME.

Update: Fixed the Safari issue with RTL Bootstrap (removed RTL Bootstrap, not needed.).

  • Chrome: Flawless
  • Opera: Flawless
  • Safari: Flawless
  • Firefox: Works fine if you really know how to whitelist and permit Javascript and localStorage().

Vue Black Dashboard Mockup v0.06

https://www.unix.com/cp/index.php

Mostly cosmetic mockup changes:

  • Changed main font-family to Montserrat (same as main site).
  • Commented out sidebar menu items not necessary for mockup.
  • Restyled a number of pages (login, registration).
  • Restyled footer a bit.
  • Simplified mockup "member thanks" staff table.
  • Removed buggy RTL Bootstrap CSS file (since we do not need right-to-left text support because we are an English-only site).
  • Put a link to the Vue UserCP Mockup in the UserCP down down menu (main site, desktop) for all registered users.

Your Digital Artist, Neo :slight_smile:

4 Likes

Vue Black Dashboard Mockup v0.07

https://www.unix.com/cp/index.php

Mostly cosmetic mockup changes:

  • Got rid of a number of the round purple buttons.
  • Added more "neo-ish" looking pics.
  • Other simple cosmetic mockup changes.

Functional change:

  • Moved mockup site specific data to external JS file:
<script src="https://www.unix.com/scripts/js/vue_usercp_mockup.min.js"></script>

Your Digital Artist and Site Slave, Neo :slight_smile:


1 Like

Vue Black Dashboard Mockup v0.08

"A Slight Change in Direction"

In early versions of this mockup I planned to use server-side PHP to write dynamic forum data to browser localStorage(); ; but now I have changed my mind and write PHP serve-side dynamic forum data as stringified Javascript objects and write the data as an external Javascript file on the server-side:

So, in this mockup version, have removed all dynamic mockup data (numeric chart data, table date, etc) and places in an external JS file, like so:

<script src="https://www.unix.com/scripts/js/vue_usercp_mockup_3.min.js?v=21"></script>

For example, in the current mockup this looks like:

var online_guests=JSON.stringify([13,156,46,288,99,333,13,156,46,88,199,33]);var online_members=JSON.stringify([223,52,406,38,992,3,131,560,46,808,99,331]);var online_staff=JSON.stringify([131,156,246,38,599,333,213,566,146,188,199,53]);var summary_forum=JSON.stringify(["2222K","8888K","111K","1"]);var prior_year=JSON.stringify(["MAR","APR","MAY","JUN","JUL","AUG","SEP","OCT","NOV","DEC","JAN","FEB"]);var prior_halfyear=JSON.stringify(["SEP","OCT","NOV","DEC","JAN","FEB"]);var six_top_countries=JSON.stringify(["USA","GER","FR","UK","IN","TH"]);var striped_table=JSON.stringify([{id:1,name:"Dakota Rice",salary:"$36.738",country:"Niger",city:"Oud-Turnhout"},{id:2,name:"Minerva Hooper",salary:"$23,789",country:"Curaçao",city:"Sinaai-Waas"},{id:3,name:"Sage Rodriguez",salary:"$56,142",country:"Netherlands",city:"Baileux"},{id:4,name:"Philip Chaney",salary:"$38,735",country:"Korea, South",city:"Overland Park"},{id:5,name:"Doris Greene",salary:"$63,542",country:"Malawi",city:"Feldkirchen in Kärnten"}]);var purple_data=JSON.stringify([80,100,70,80,120,80]);var green_data=JSON.stringify([90,27,60,12,80,200]);var blue_data=JSON.stringify([53,20,10,80,100,45]);var pie2=JSON.stringify([["red","steelblue","navy"],[100,400,200]]);var pie1=JSON.stringify([["blue","red","limegreen","indigo"],[60,40,20,10]]);
https://www.unix.com/cp/index.php

Changes:

  • Moved all dynamic data to server-side Javascript.
  • Removed localStorage() for server-side forum data.
  • Changed all Vue components (charts, tables, badges) to get the data from the external JS file.

My plan is to write a PHP cron to pull the MySQL data for the VueCP and write the data to an external JS file (like the one above) and to use a random number on the external JS script URL to bust the cache so it updates when the user reloads the page.

So, in the first mockups with live data, I will not use AJAX calls on the clients-side; but will do the heavy lifting on the server-side, until I change my mind again :slight_smile:

Mockup v0.09

I have not uploaded this to the server yet (developing on my desktop), but FYI I have the mockup of the top two rows of the dashboard working with actual forum data (updating hourly), showing the thanks per month, discussions per month and posts per month over the past year and the lifetime totals for discussions, posts, participating users and thanks. See images below:

Vue Black Dashboard Mockup v0.09

"First Mockup with Live Forum Data"

Per the post above, I have written the PHP code to pull live data and create the required JS to make this work;

  • Top Row: One year of data for thanks per month, discussions per month, and posts per month.
  • Second Row: Four "lifetime badges" for discussions, posts, participating users and thanks

.

I would post the PHP code, but it's a mess at this point in time and I'm embarrassed to post it until I clean it up, LOL. Here is one function, the "make the JSON file for the yearly discussions stats:

<?php
function make_threads()
{
    global $vbulletin;
    for ($i = 11; $i >= 0; $i--) {
        $start = mktime(0, 0, 0, date("m") - $i, 1, date("Y"));
        $end = mktime(0, 0, 0, date("m") - ($i - 1), 1, date("Y"));
        $query = "select count(threadid) as count from thread where dateline >=" . $start . " AND dateline <" . $end;
        $t = $vbulletin->db->query_first($query);
        $threads[] = $t['count'];
    }
    $string = json_encode($threads);
    return $string;
}

Example output from function:

["445","456","511","442","320","264","281","202","189","217","255","176"]