how to check memory usage ?

hello,

I have purchased VPS from one webhosting company. VPS comes with Virtuozzo power panel. It has 512MB gurranted RAM and dynamic RAM 2048 MB.

I have hosted single domain with 50MB database and wordpress installation.

But I am getting resource alerts. It goes sometime in yellow zone. I am not able to trace which thing is consuming more memory. My site has 3000 posts and 50,000 comments. is it because of that ? is it because of apache and mysql connections ? it is because of any plug-ins ?

how to trace that ? I have installed putty and typed "top" which is showing me following status at this time :

Tasks:  41 total,   4 running,  36 sleeping,   0 stopped,   1 zombie
Cpu(s):  2.3%us,  0.7%sy,  0.0%ni, 97.0%id,  0.0%wa,  0.0%hi,  0.0%si,  0.0%st
Mem:   2097152k total,   387380k used,  1709772k free,        0k buffers
Swap:        0k total,        0k used,        0k free,        0k cached

  PID USER      PR  NI  VIRT  RES  SHR S %CPU %MEM    TIME+  COMMAND
21632 readguja  15   0  160m  35m 7072 R 11.3  1.8   0:00.34 php-cgi
21634 readguja  16   0  152m  27m 6768 R  8.6  1.4   0:00.26 php-cgi
20348 apache    16   0     0    0    0 Z  1.7  0.0   0:00.09 httpd <defunct>
30666 mysql     15   0  233m  28m 5860 S  0.7  1.4 188:10.08 mysqld
    1 root      15   0 10348  740  620 S  0.0  0.0   0:03.32 init
 3642 root      18   0 96572 3764 2896 R  0.0  0.2   0:00.06 sshd
 3759 root      15   0 12064 1640 1288 S  0.0  0.1   0:00.05 bash
 8009 postfix   18   0 54208 2376 1816 S  0.0  0.1   0:00.10 tlsmgr
14329 apache    18   0  227m 9580  472 S  0.0  0.5   0:01.16 httpd
19990 apache    18   0  289m  12m 1684 S  0.0  0.6   0:00.13 httpd
20321 apache    18   0  289m  12m 1688 S  0.0  0.6   0:00.06 httpd
20378 apache    16   0  289m  12m 1680 S  0.0  0.6   0:00.05 httpd
21519 apache    18   0  289m  12m 1688 S  0.0  0.6   0:00.01 httpd
21593 root      15   0 12608 1200  924 R  0.0  0.1   0:00.01 top
21608 apache    15   0  288m  12m 1644 S  0.0  0.6   0:00.00 httpd
21613 apache    18   0  288m  12m 1644 S  0.0  0.6   0:00.00 httpd
21615 apache    15   0  288m  12m 1664 S  0.0  0.6   0:00.00 httpd
21770 postfix   16   0 55104 2300 1776 S  0.0  0.1   0:00.00 pickup
25952 root      18  -4 12604  676  360 S  0.0  0.0   0:00.00 udevd
26262 root      15   0  5908  624  500 S  0.0  0.0   0:04.25 syslogd
26295 root      15   0 62624 1208  648 S  0.0  0.1   0:11.85 sshd
26304 root      15   0 21644  936  724 S  0.0  0.0   0:00.08 xinetd
26320 root      21   0 13164  600  468 S  0.0  0.0   0:00.00 couriertcpd
26322 root      18   0  3656  376  308 S  0.0  0.0   0:00.00 courierlogger
26330 root      20   0 13164  600  468 S  0.0  0.0   0:00.00 couriertcpd
26333 root      22   0  3656  380  308 S  0.0  0.0   0:00.00 courierlogger
26339 root      15   0 13164  612  476 S  0.0  0.0   0:00.08 couriertcpd
26341 root      18   0  3788  552  464 S  0.0  0.0   0:00.01 courierlogger
26348 root      20   0 13164  600  468 S  0.0  0.0   0:00.00 couriertcpd
26350 root      20   0  3656  372  308 S  0.0  0.0   0:00.00 courierlogger
26407 root      18   0 54148 2308 1764 S  0.0  0.1   0:12.82 master
26414 postfix   15   0 54396 2424 1836 S  0.0  0.1   0:03.02 qmgr
26418 root      18   0  288m  19m 9812 S  0.0  1.0   0:38.42 httpd
26438 root      15   0 20872 1188  588 S  0.0  0.1   0:01.36 crond

How can i find that which thing is consuming more memory ?

please help. I have no detail idea of linux.

Kind of common with VPS's that run OpenVZ. I believe Virtuozzo uses OpenVZ or something similiar.

I would submit a ticket to your provider letting them see your output from TOP. Let them know that it does not appear that you are using much memory.

Then cat your user_beancounters and include that. I would assume that you are exceeding something there.

Make sure you include this info to them.

cat /proc/user_beancounters
free
ps aux | awk '{sum +=$4}; END {print sum}'

[1] when I run "cat /proc/user_beancounters" on server, it showed me following details :

here is the image :

      uid     resource                     held                  maxheld              barrier                limit                       failcnt

62375702: kmemsize 14493878 16603817 20971520 23068672 18561
lockedpages 0 0 256 256 0
privvmpages 81264 91477 524288 576716 0
shmpages 888 888 20480 20480 115
dummy 0 0 9223372036854775807 9223372036854775807 0
numproc 55 58 96 96 0
physpages 24198 32957 2147483647 2147483647 0
vmguarpages 0 0 131072 2147483647 0
oomguarpages 24199 32958 9223372036854775807 2147483647 0
numtcpsock 24 26 360 360 0
numflock 11 11 188 206 0
numpty 1 1 16 16 0
numsiginfo 0 1 256 256 0
tcpsndbuf 358112 466024 1720320 2703360 19232554
tcprcvbuf 214112 219512 1720320 2703360 0
othersockbuf 204072 289440 1126080 2097152 0
dgramrcvbuf 0 0 262144 288358 0
numothersock 122 124 360 360 0
dcachesize 1162482 1196286 3145728 3460300 0
numfile 2129 2258 4096 4096 653
dummy 0 0 0 0 0
dummy 0 0 0 0 0
dummy 0 0 0 0 0
numiptent 18 18 100 105 0

[2] when I run "free" command, it showed me following details :

                     total          used       free          shared     buffers     cached

Mem: 2097152 323980 1773172 0 0 0
-/+ buffers/cache: 323980 1773172
Swap: 0 0 0

[3] when I run "ps aux | awk '{sum +=$4}; END {print sum}'" command, it show me following output :
output : 12.4

my server goes to yellowzone because of kemsize.

now please guide me, what I can do to remove high load. what are the reasons for highload.

please help.

Well removing high load on a web application really depends on many things. Poor coding, lots of traffic, how you have sql setup will all play a role in performance.

I would check the php-cgi application.

Are you getting a lot of web traffic?

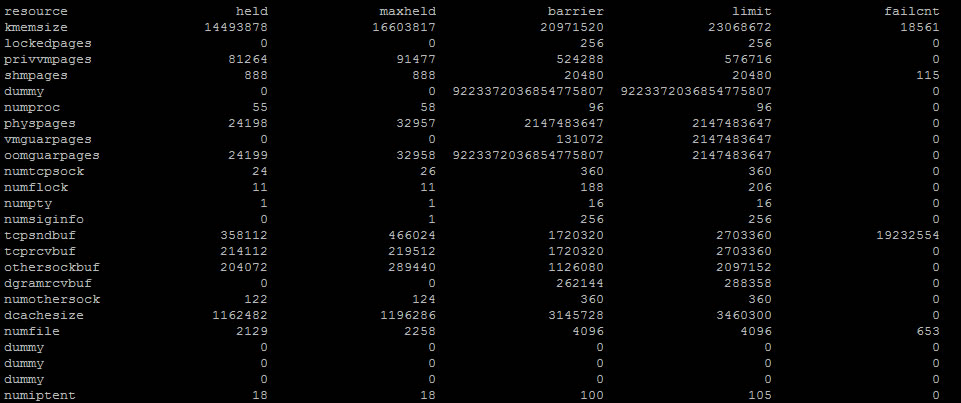
Run the below command and report with what you see:

ps auxw| awk '{print $6" "$0}' | grep MEM | grep -v grep && ps auxw| awk '{print $6" "$0}' | sort -n | tail -5

---------- Post updated at 10:46 AM ---------- Previous update was at 10:38 AM ----------

Take a look at this interesting ([SOLVED] php5-cgi causes abnormally high cpu-load)

I am using wordpress installation and using some standard plugins.

I have 400 visitors per hour and daily 1500 unique visitors. Database size is 50MB. but it has 1200 posts and 25,000 comments. I think it is creating number of connections when readers connects and stay long time on site for reading articles. I have not made any manual php files. everything is wordpress.

here is the output by running the following command :

ps auxw| awk '{print $6" "$0}' | grep MEM | grep -v grep && ps auxw| awk '{print $6" "$0}' | sort -n | tail -5

12560 apache   19698  0.0  0.5 296128 12560 ?        S    10:43   0:00 /usr/sbin/httpd
20456 root     26418  0.0  0.9 295104 20456 ?        Ss   Mar08   0:48 /usr/sbin/httpd
28440 mysql    30666  5.3  1.3 239548 28440 ?        Sl   Mar08 231:03 /usr/libexec/mysqld --basedir=/usr --datadir=/var/lib/mysql --user=mysql --pid-file=/var/        run/mysqld/mysqld.pid --skip-external-locking --socket=/var/lib/mysql/mysql.sock
45068 popuser  31873  0.0  2.1 107864 45068 ?        S    Mar08   0:00 spamd child
46528 root     31867  0.0  2.2 107864 46528 ?        Ss   Mar08   0:04 /usr/bin/spamd --username=popuser --daemonize --nouser-config --helper-home-dir=/var/qmai        l --max-children 1 --create-prefs --virtual-config-dir=/var/qmail/mailnames/%d/%l/.spamassassin --pidfile=/var/run/spamd/spamd_full.pid --socketpath=/tmp/spamd_        full.sock

Get with your hosting company and ask them to increase your kmemsize. You are over this resource. Many hosting companies advertise lots of ram, but limit the kmemsize so that you don't actually use much of it.

uid resource held maxheld barrier limit failcnt
kmemsize 14493878 16603817 20971520 23068672 18561

---------- Post updated at 10:56 AM ---------- Previous update was at 10:51 AM ----------

Also you may want to check spamassassin. Looks like that may be taking a beating.

so from my side, the data, and resource usage is OK ?

it is service providers fault ?

i just want to know that whether my site's load is too much or it is normal ?

---------- Post updated at 11:58 AM ---------- Previous update was at 11:57 AM ----------

but how to check spamassassin ? from where to check ?

---------- Post updated at 12:00 PM ---------- Previous update was at 11:58 AM ----------

but how to check spamassassin ? from where to check ?

Well to be honest, you have what I would say large traffic for wordpress. Good job btw, I would love to have 400 unique visitors per hour.

To be fair, the hosting company is providing you with 512 megs of RAM with 2048 megs of burstable RAM. I think with your site's traffic, you should be on a larger VPS (Maybe even dedicated)

You may want to get another VPS or dedicated server and have the MYSQL reside there dedicated to MYSQL only. NO email, HTTP or anything.

Then I would modify your blog software to connect to that MYSQL in your configuration include document.

Other things can cause a system to have high CPU / MEMORY utilization such as DISK IO.

Hopefully you get some advertising off of your site or donations that can help offset your costs.

I hope that this helps a bit, but unfortnately my friend . . . your site may just be doing too good for that little VPS :slight_smile:

thank you very much, I think you are right. It is very heavy load. And my site has literature articles, so people read for longer times and goes to previous articles. I also have archive which has 2400 articles and 30,000 more comments which I have made static but it is also on same VPS.

you will be surpirsed to know that, till last month I was running all this on shard hosting...!! :slight_smile: