Hi,
i would like to change color depending from the valuerange.
a gnuplot-script will generate a multiplot and in one graph,
the ranges should have different colors, e.g.
100 ... 133 --> red
200 ... 233 --> blue
300 ... 333 --> orange
400 ... 433 --> green
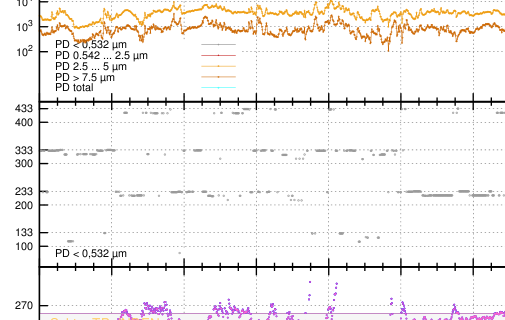
#Partikeldata - Partikel INDEX  - [ 4 ]
set size 1,0.17
set origin 0,0.32
set format x ""
#set key left Left bot font "Helvetica,8"
set noxlabel
#set log y
#set mytics 10
#set grid mytics linestyle 0 linewidth .8
set yrange [50:450]
set ytics (100,133,200,233,300,333,400,433)
#set format y "10^{%L}"
#set grid x
set key left Left bot font "Helvetica,8"
set noxlabel
set label 1 "Partikel-INDEX" at graph 1.0, graph 0.5 rotate by 90 center offset 1,0 font "Helvetica,8"
set cbrange [100:433]
set palette defined (0 "blue",17 "#00ffff",33 "white",50 "yellow",\
    66 "red",100 "#990000",101 "grey")
plot "${Home}/scripte/index.txt" using 1:(\$2) t '   PD < 0,532 �m' w p pt 6 ps 0.2 lc rgbcolor "#999999"
I tried to solve it with the blue colored "set range / set palette" but it didnt work - all the generated dots are red. Can somebody help me?
Thanks in advance!
IMPe